Fig. 17
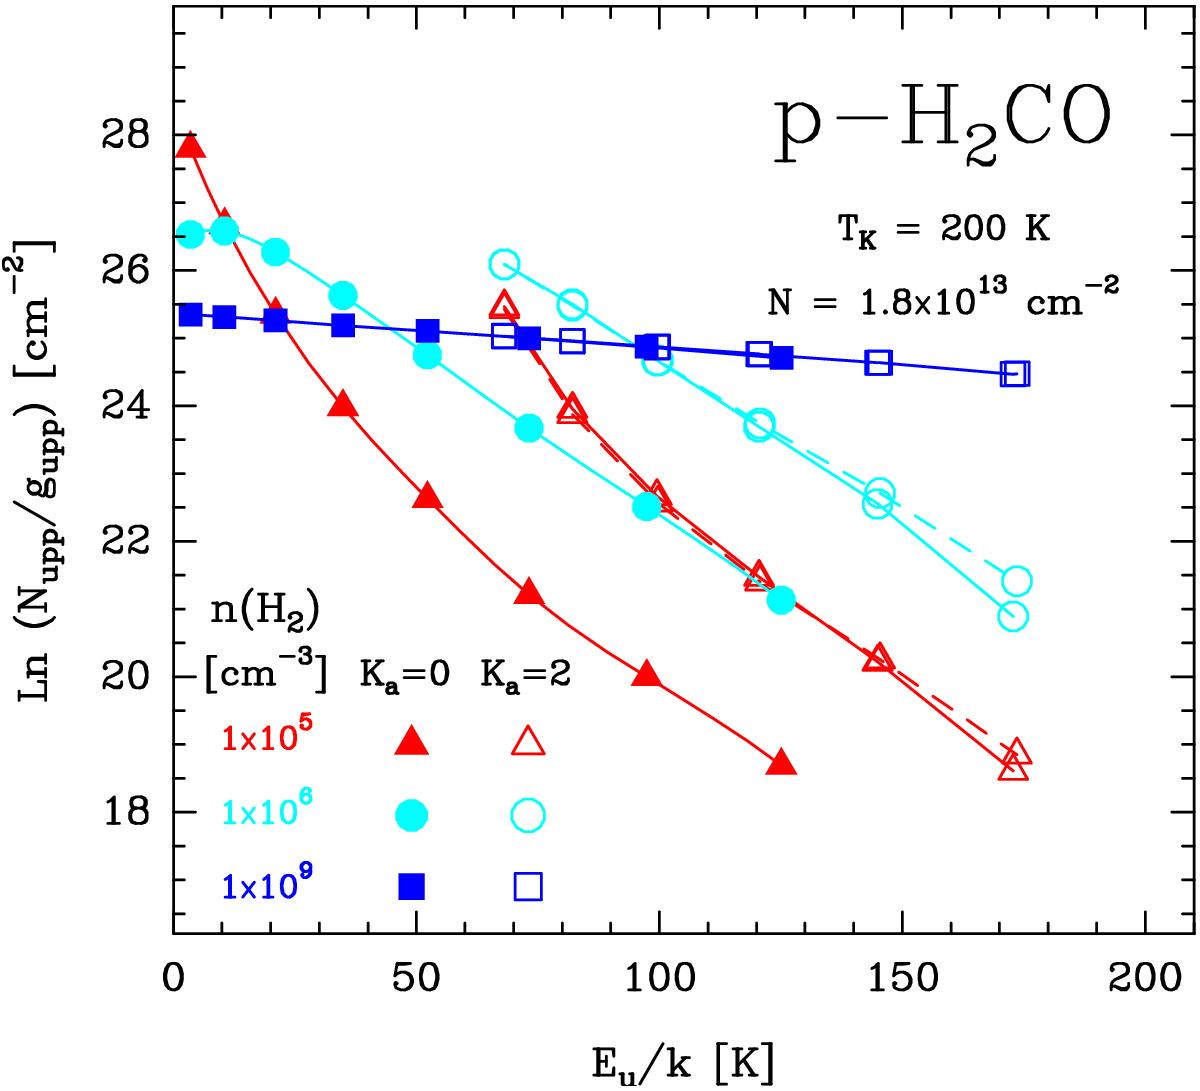
Rotational population diagrams for p-H2CO computed with a non-LTE excitation code. All models adopt the same gas temperature (Tk = 200 K) and column density (Ntot = 1.8 × 1013 cm-2), but three different n(H2) values. For simplicity, only rotational transitions in the Ka = 0 (filled symbols) and 2 (empty symbols) ladders are shown. We note that at densities <108 cm-3, the set of transitions with the Ka = 2 number are also split into two components: (i) transitions with Kc = J–1 (empty symbols connected with solid lines) and (ii) transitions with Kc = J–2 (empty symbols connected with dashed lines).
Current usage metrics show cumulative count of Article Views (full-text article views including HTML views, PDF and ePub downloads, according to the available data) and Abstracts Views on Vision4Press platform.
Data correspond to usage on the plateform after 2015. The current usage metrics is available 48-96 hours after online publication and is updated daily on week days.
Initial download of the metrics may take a while.