Free Access
Fig. 14
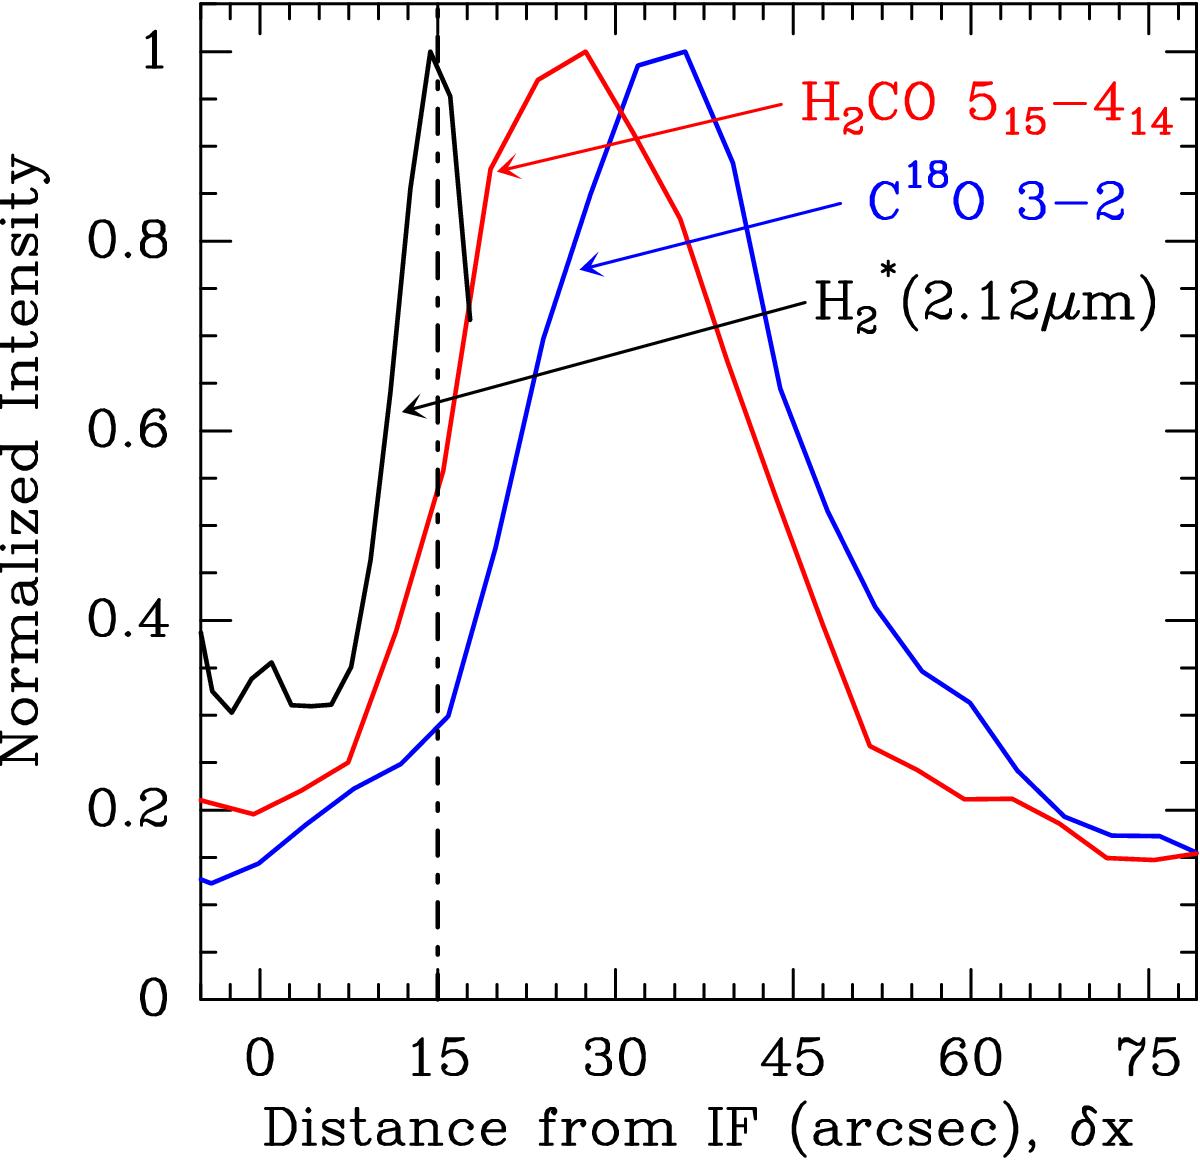
Normalised intensity crosscuts for C18O J = 3 → 2 (blue curve), H2CO JKa,Kc = 51,5 → 41,4 (red curve), and H![]() (black curve) as a function of distance from the IF (in arcsec). The vertical dot-dashed line indicates the H2 dissociation front. FUV radiation comes from left.
(black curve) as a function of distance from the IF (in arcsec). The vertical dot-dashed line indicates the H2 dissociation front. FUV radiation comes from left.
Current usage metrics show cumulative count of Article Views (full-text article views including HTML views, PDF and ePub downloads, according to the available data) and Abstracts Views on Vision4Press platform.
Data correspond to usage on the plateform after 2015. The current usage metrics is available 48-96 hours after online publication and is updated daily on week days.
Initial download of the metrics may take a while.