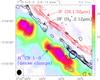
Fig. 1
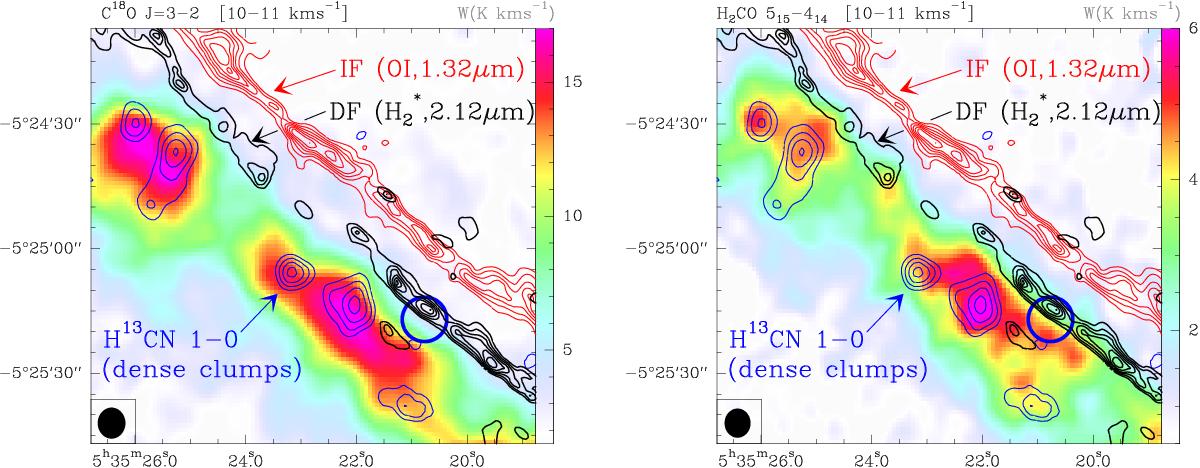
C18O J = 3 → 2 (left panel) and H2CO JKa,Kc = 51,5 → 41,4 (right panel) line integrated intensity maps (W in K km s-1) in the 10−11 km s-1 velocity interval observed with the IRAM 30 m telescope at ~329 GHz and ~351 GHz, respectively (colour scale). Black contours are the H![]() v = 1 → 0 S(1) emission delineating the H2 dissociation front (DF, Walmsley et al. 2000). The red contours represent the O i fluorescent line at 1.32 μm (Walmsley et al. 2000) marking the position of the ionisation front (IF) that separates the H ii region and the neutral cloud. The blue contours represent the H13CN J = 1 → 0 emission tracing dense molecular clumps inside the Bar (Lis & Schilke 2003). The target position of the Orion Bar survey, close to the DF, is indicated with a blue circle. The IRAM 30 m beam at 1 mm is plotted in the bottom left corner (black circle).
v = 1 → 0 S(1) emission delineating the H2 dissociation front (DF, Walmsley et al. 2000). The red contours represent the O i fluorescent line at 1.32 μm (Walmsley et al. 2000) marking the position of the ionisation front (IF) that separates the H ii region and the neutral cloud. The blue contours represent the H13CN J = 1 → 0 emission tracing dense molecular clumps inside the Bar (Lis & Schilke 2003). The target position of the Orion Bar survey, close to the DF, is indicated with a blue circle. The IRAM 30 m beam at 1 mm is plotted in the bottom left corner (black circle).
Current usage metrics show cumulative count of Article Views (full-text article views including HTML views, PDF and ePub downloads, according to the available data) and Abstracts Views on Vision4Press platform.
Data correspond to usage on the plateform after 2015. The current usage metrics is available 48-96 hours after online publication and is updated daily on week days.
Initial download of the metrics may take a while.