Fig. 9
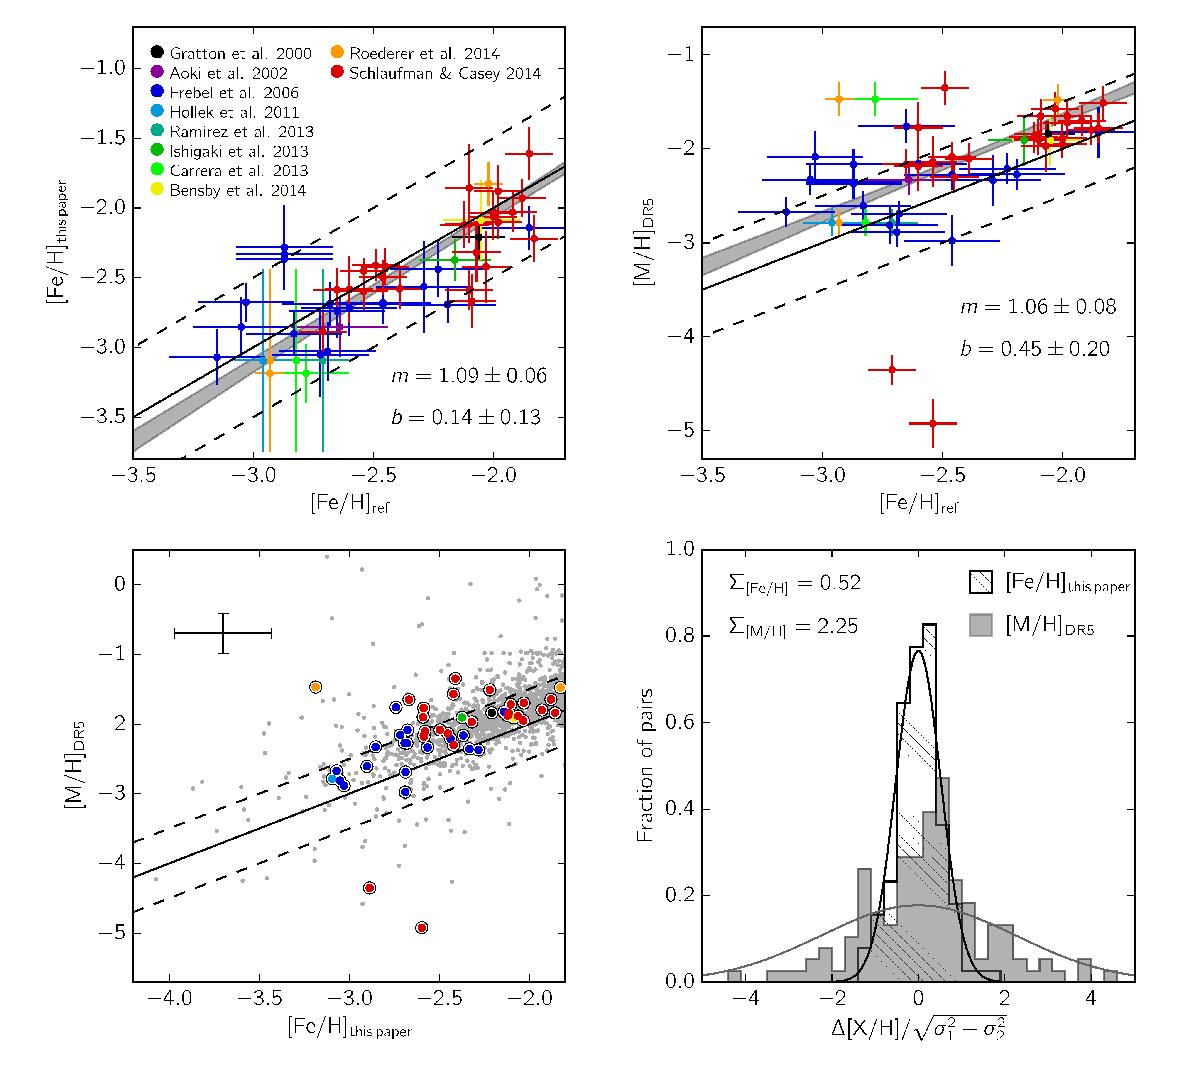
Top left panel: comparison of the derived metallicity values to the literature values from various sources. The top right panel is similar, except that the vertical axis shows the values derived by the RAVE DR5 pipeline (M in the label denotes all elements heavier than He). Reference data are from Gratton et al. (2000), Aoki et al. (2002), Frebel et al. (2006), Hollek et al. (2011), Ramírez et al. (2013), Ishigaki et al. (2013), Carrera et al. (2013), Bensby et al. (2014), Roederer et al. (2014), Schlaufman & Casey (2014). All reference metallicities were derived from spectroscopy except for those given by Frebel et al. (2006, dark blue), which are photometric. The gray areas denote the ± 1σ linear fits to the data points. The line slope (m) and intercept (b) for each are given in the respective panels. The bottom left panel shows the relation between newly derived values and RAVE DR5 metallicities for candidates with [Fe/H] < −1.9 dex (individual error bars are not shown for clarity, but we show a representative error bar in the upper left corner). Note the difference in the metallicity range on both axes. The bottom left panel is similar to the top row in Fig. 5, except that it shows the pairwise differences in metallicity measurements between the repeated observations. The filled histogram represents DR5 values, while the hatched histogram shows the new values. The overplotted lines are Gaussians with widths measured from the data and indicated in the upper left corner of this panel.
Current usage metrics show cumulative count of Article Views (full-text article views including HTML views, PDF and ePub downloads, according to the available data) and Abstracts Views on Vision4Press platform.
Data correspond to usage on the plateform after 2015. The current usage metrics is available 48-96 hours after online publication and is updated daily on week days.
Initial download of the metrics may take a while.