Fig. 8
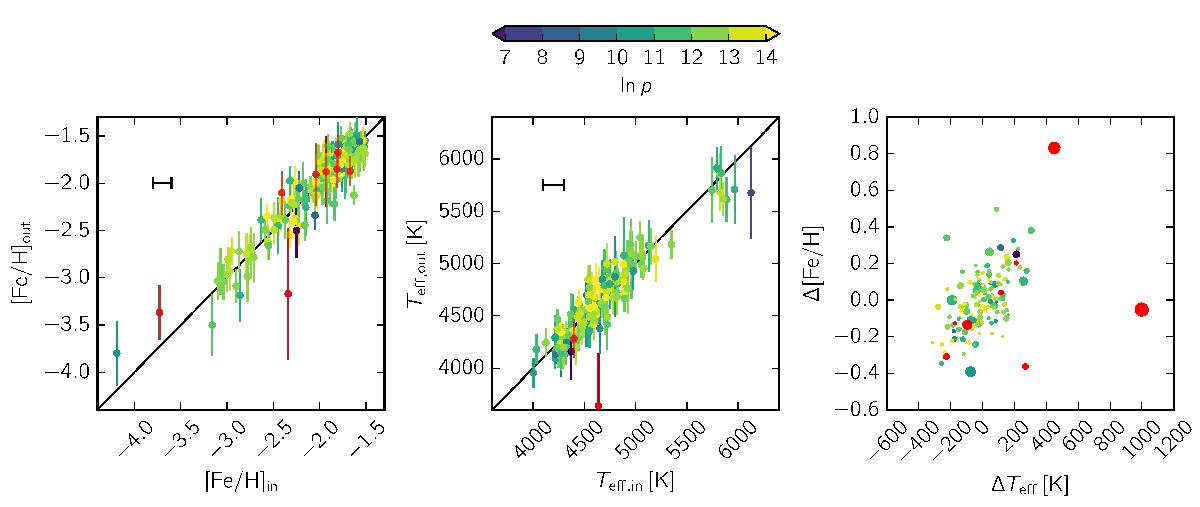
Leave-one-out cross-validation of the training sample. The left and center panels show input vs. output values for [Fe/H] and Teff. The uncertainty of the input value is given by the error bar in each diagram. The right panel shows the differences between the input and the output values for both parameters, with larger circles representing solutions with higher total relative uncertainty (in both temperature and metallicity). Brighter colors correspond to the more reliable solutions with higher likelihood lnp. Red symbols mark all solutions with multimodal posteriors for which a single value is a poor estimator and should therefore not be used.
Current usage metrics show cumulative count of Article Views (full-text article views including HTML views, PDF and ePub downloads, according to the available data) and Abstracts Views on Vision4Press platform.
Data correspond to usage on the plateform after 2015. The current usage metrics is available 48-96 hours after online publication and is updated daily on week days.
Initial download of the metrics may take a while.