Fig. 5
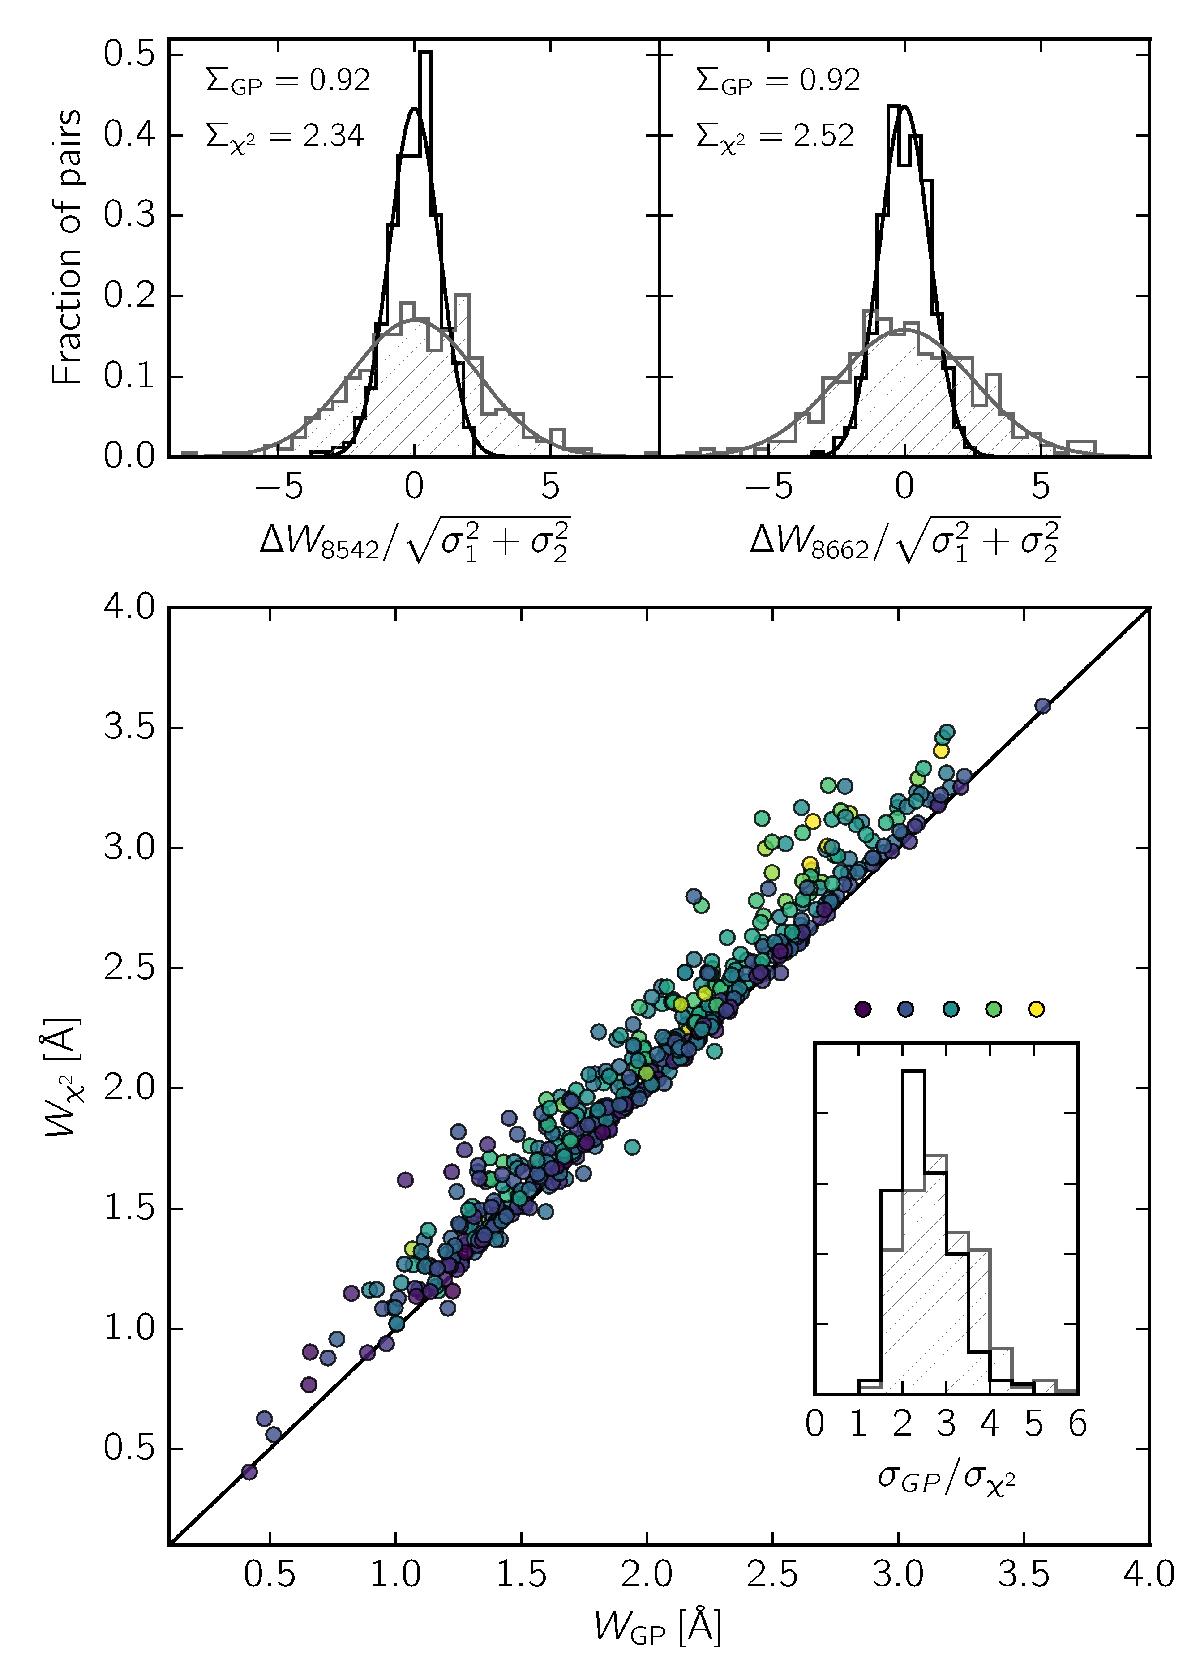
Bottom diagram: comparison between the EWs measured using the Gaussian processes (GP) and EWs coming from a simple χ2 analysis. EW measurements for the line at 8498 Å are not shown. The inset shows the histogram of the uncertainty ratios. Brighter colors of the dots correspond to higher ratio values. Top diagrams: histograms of the differences between the ith and the jth repeated observation for the lines at 8542 Å and 8662 Å. The black histogram includes the measurements generated by Gaussian processes, the gray histogram shows the χ2 derived values. Gaussian distributions with equivalent standard deviations Σ are overplotted, which should ideally be equal to 1.
Current usage metrics show cumulative count of Article Views (full-text article views including HTML views, PDF and ePub downloads, according to the available data) and Abstracts Views on Vision4Press platform.
Data correspond to usage on the plateform after 2015. The current usage metrics is available 48-96 hours after online publication and is updated daily on week days.
Initial download of the metrics may take a while.