Fig. 3
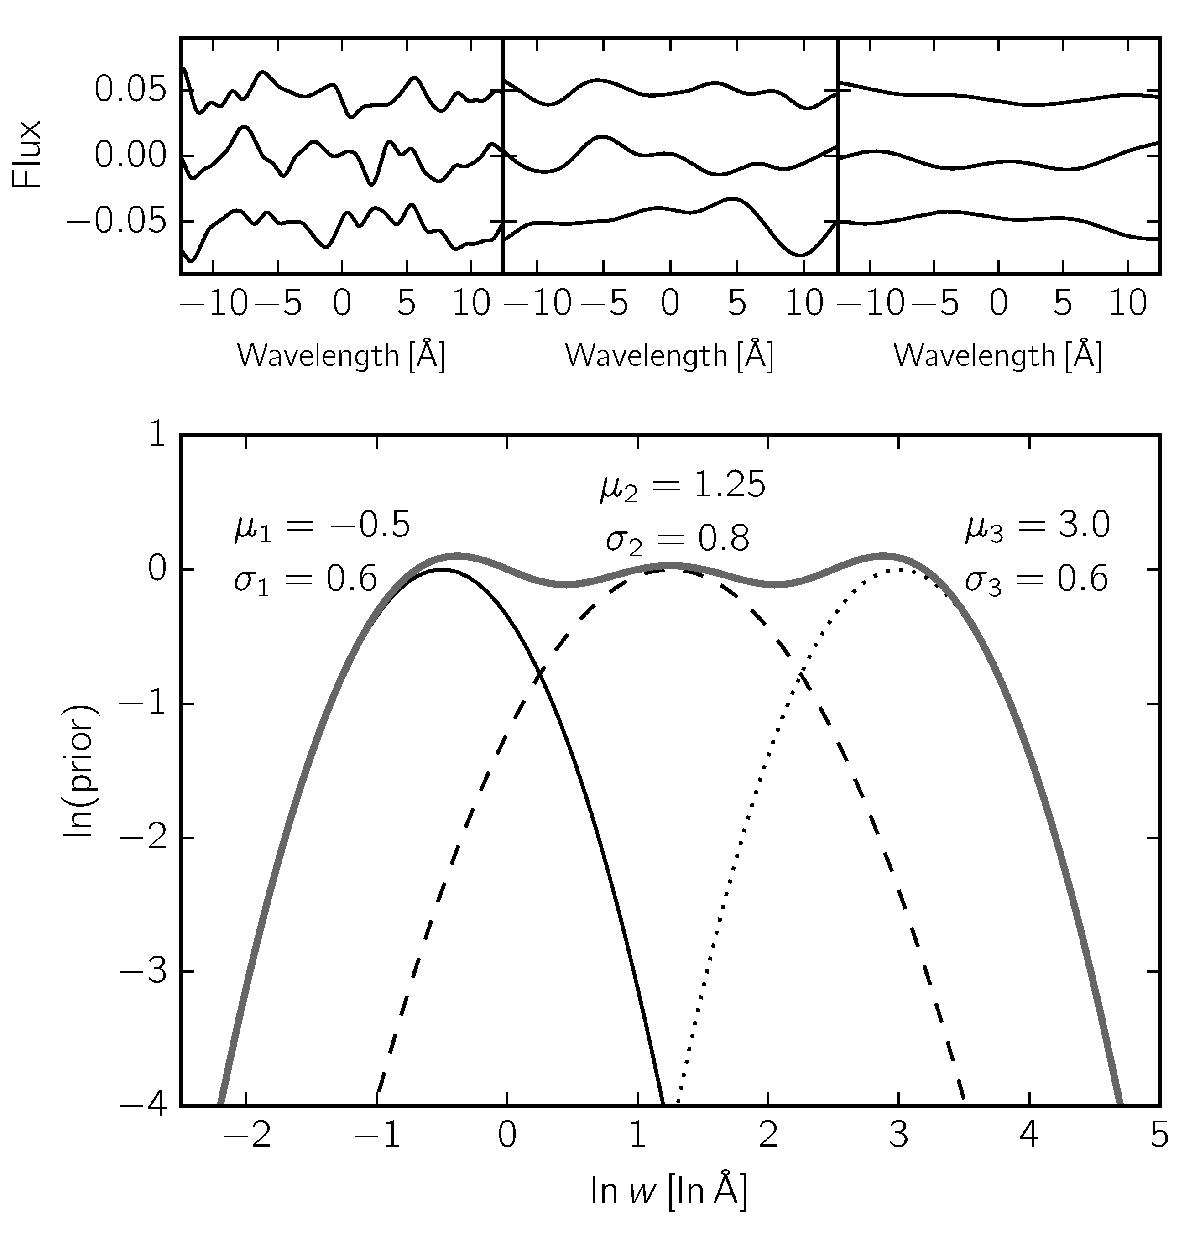
Bottom panel: priors imposed on the length scale of the three squared exponential kernels used for the profile noise modeling. The labels μ and σ denote the mean and the standard deviation of each Gaussian distribution, respectively. The thick gray line is the sum of all three. Each of the top three panels shows three functions generated by each kernel and w values randomly drawn from the corresponding prior. The amplitudes were chosen so that they roughly match the typical variations in the RAVE spectra. The functions are separated by 0.05 in the vertical direction for clarity.
Current usage metrics show cumulative count of Article Views (full-text article views including HTML views, PDF and ePub downloads, according to the available data) and Abstracts Views on Vision4Press platform.
Data correspond to usage on the plateform after 2015. The current usage metrics is available 48-96 hours after online publication and is updated daily on week days.
Initial download of the metrics may take a while.