Fig. 10
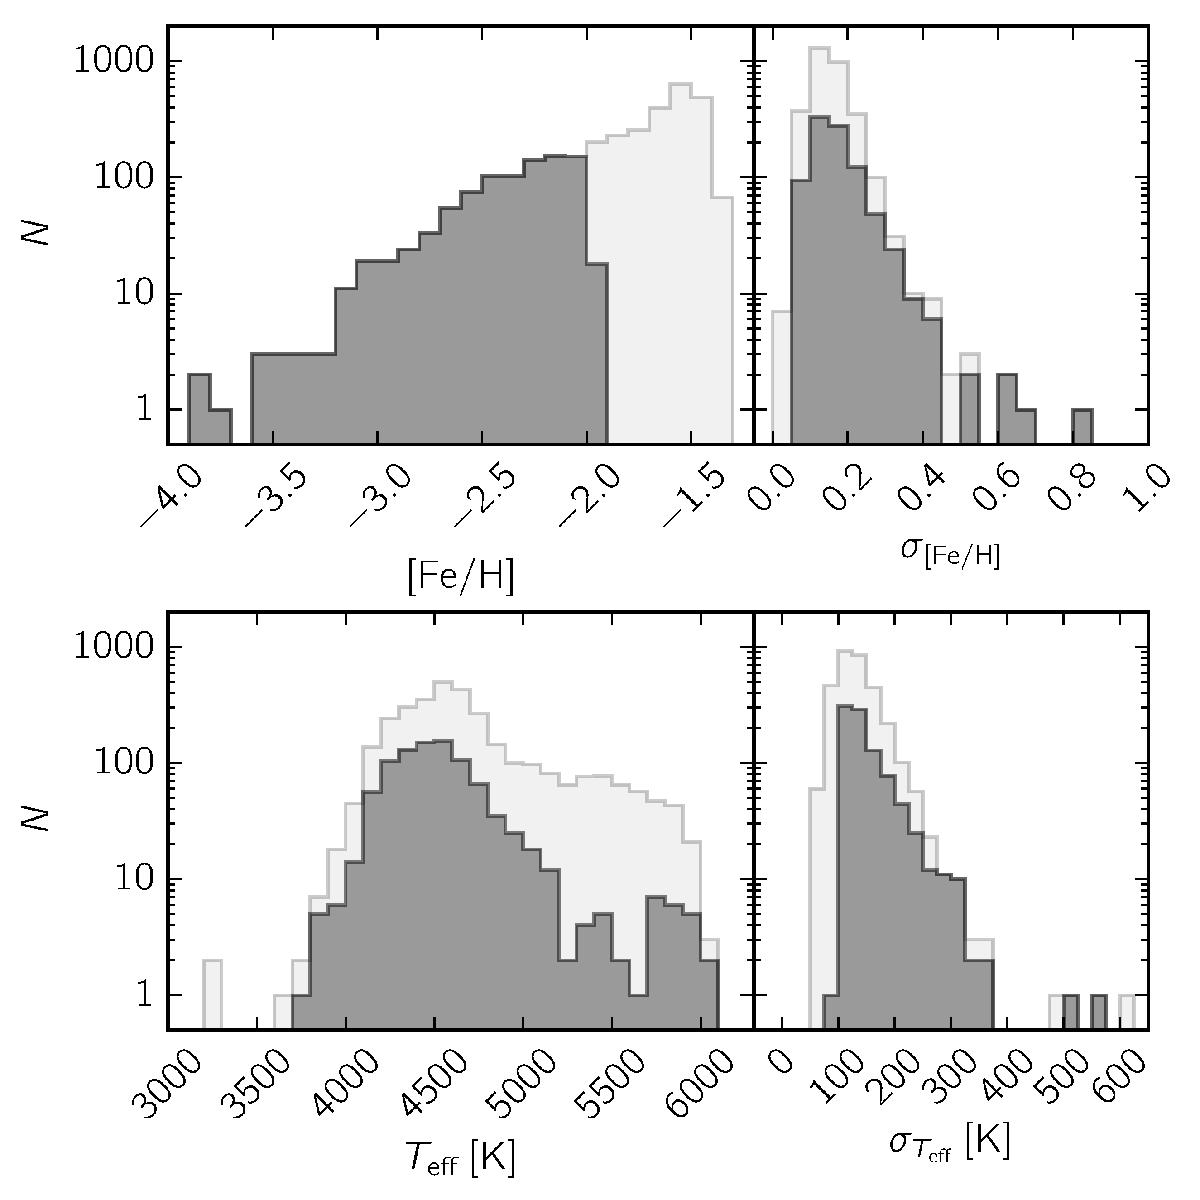
Metallicity distribution function and the distribution of the metallicity uncertainties (top), and the same for effective temperature (bottom). The means of the individual posteriors were used to construct the histogram on the left side. The right side histograms show the standard deviations of the posteriors. The light gray histograms include all candidate stars, and the dark gray histograms include all cases with a 50% probability for the computed metallicity to be at least below [Fe/H] = −2 dex.
Current usage metrics show cumulative count of Article Views (full-text article views including HTML views, PDF and ePub downloads, according to the available data) and Abstracts Views on Vision4Press platform.
Data correspond to usage on the plateform after 2015. The current usage metrics is available 48-96 hours after online publication and is updated daily on week days.
Initial download of the metrics may take a while.