Fig. 8
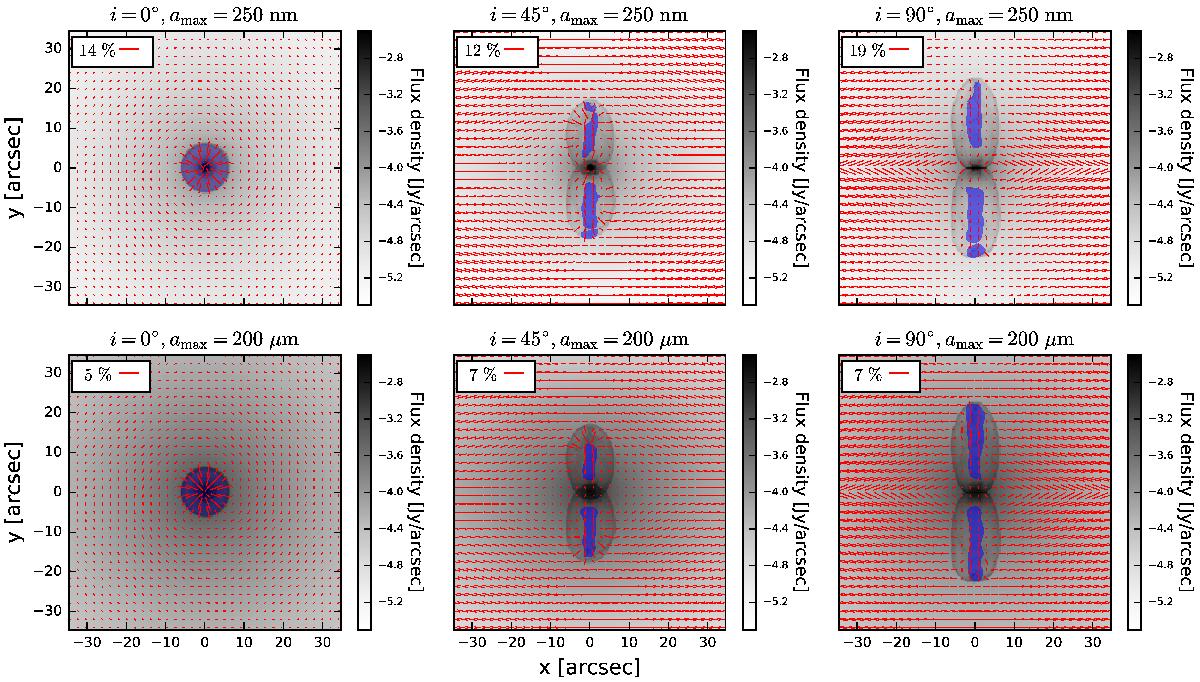
Synthetic flux density maps (gray coded) with a wavelength of λ = 1.3 mm and a distance of 140 pc overlaid with vectors of linear polarization considering RAT alignment for inclination angles of i = 0° (left column), i = 45° (middle column), and i = 90° (right column) and maximum dust grain radii of amax = 250 nm (top row) and amax = 200 μm (bottom row). The length of the vectors depends on the degree of linear polarization. For better comparison the color bar is fixed between Fmin = − 4.0 log 10(Jy / arcsec) and Fmax = − 2.0 log 10(Jy / arcsec) in all plots. The blue areas indicate where the polarization vectors represent the helical magnetic field morphology of the outflow itself according to the LOS analysis.
Current usage metrics show cumulative count of Article Views (full-text article views including HTML views, PDF and ePub downloads, according to the available data) and Abstracts Views on Vision4Press platform.
Data correspond to usage on the plateform after 2015. The current usage metrics is available 48-96 hours after online publication and is updated daily on week days.
Initial download of the metrics may take a while.