Fig. 5
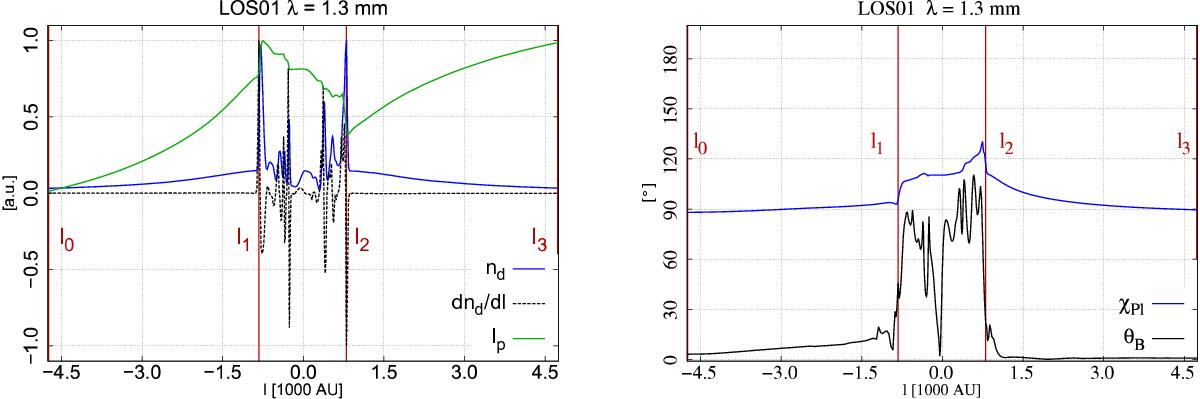
Physical quantities along the a exemplary LOS #1 in the bottom right of Fig. 3. The vertical red lines indicate the borders between the first outer region (l0 − l1), the interior of the outflow lobes (l1 − l2), and the second outer region (l2 − l3). Left panel: normalized values of polarized intensity Ip (green), dust number density nd (blue), and its first derivative dnd(l) / dl (dotted black). The polarized intensity Ip is plotted as a cumulative value. Right panel: orientation angles of linear polarization χPl (blue) and magnetic field direction θB (black). An orientation angle of 0° corresponds to vertical polarization vectors in all figures shown in this paper.
Current usage metrics show cumulative count of Article Views (full-text article views including HTML views, PDF and ePub downloads, according to the available data) and Abstracts Views on Vision4Press platform.
Data correspond to usage on the plateform after 2015. The current usage metrics is available 48-96 hours after online publication and is updated daily on week days.
Initial download of the metrics may take a while.