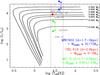
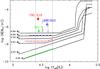
Fig. 8

Adapted from Figs. 12 and 5 of Bloecker (1995). Top: Post-AGB evolutionary tracks with observational data for RRLs and non-RRL detections (filled and empty symbols, respectively – Table 1). For MWC 922 and M 2-9, the uncertainty of the luminosity due to the uncertainty of the distance is indicated by the arrows. The stellar mass of the post-AGB remnant core of each track is indicated to its right. Vertical dotted lines delimit the ionization onset region (Teff ~ 20 000–40 000 K) where our targets lie. Bottom: Post-AGB mass-loss vs. effective temperatures adopted by post-AGB models of 0.605, 0.696, 0.836, and 0.894 M⊙ (Bloecker 1995) and of 0.546 M⊙ and 0.565 M⊙ (from Schönberner 1983). As in the top panel, the symbols indicate the location of our targets using the values of ṀpAGB deduced in this work (Tables 4 and 5; vertical error bars correspond to an uncertainty factor of 2). The thick dash- and dot-dashed lines indicate the mass-loss rate typically assumed by evolutionary models for our three objects with RRL detections.
Current usage metrics show cumulative count of Article Views (full-text article views including HTML views, PDF and ePub downloads, according to the available data) and Abstracts Views on Vision4Press platform.
Data correspond to usage on the plateform after 2015. The current usage metrics is available 48-96 hours after online publication and is updated daily on week days.
Initial download of the metrics may take a while.