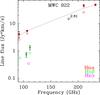
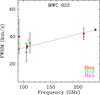
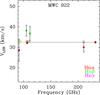
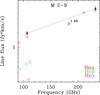
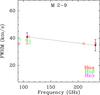
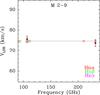
Fig. 6
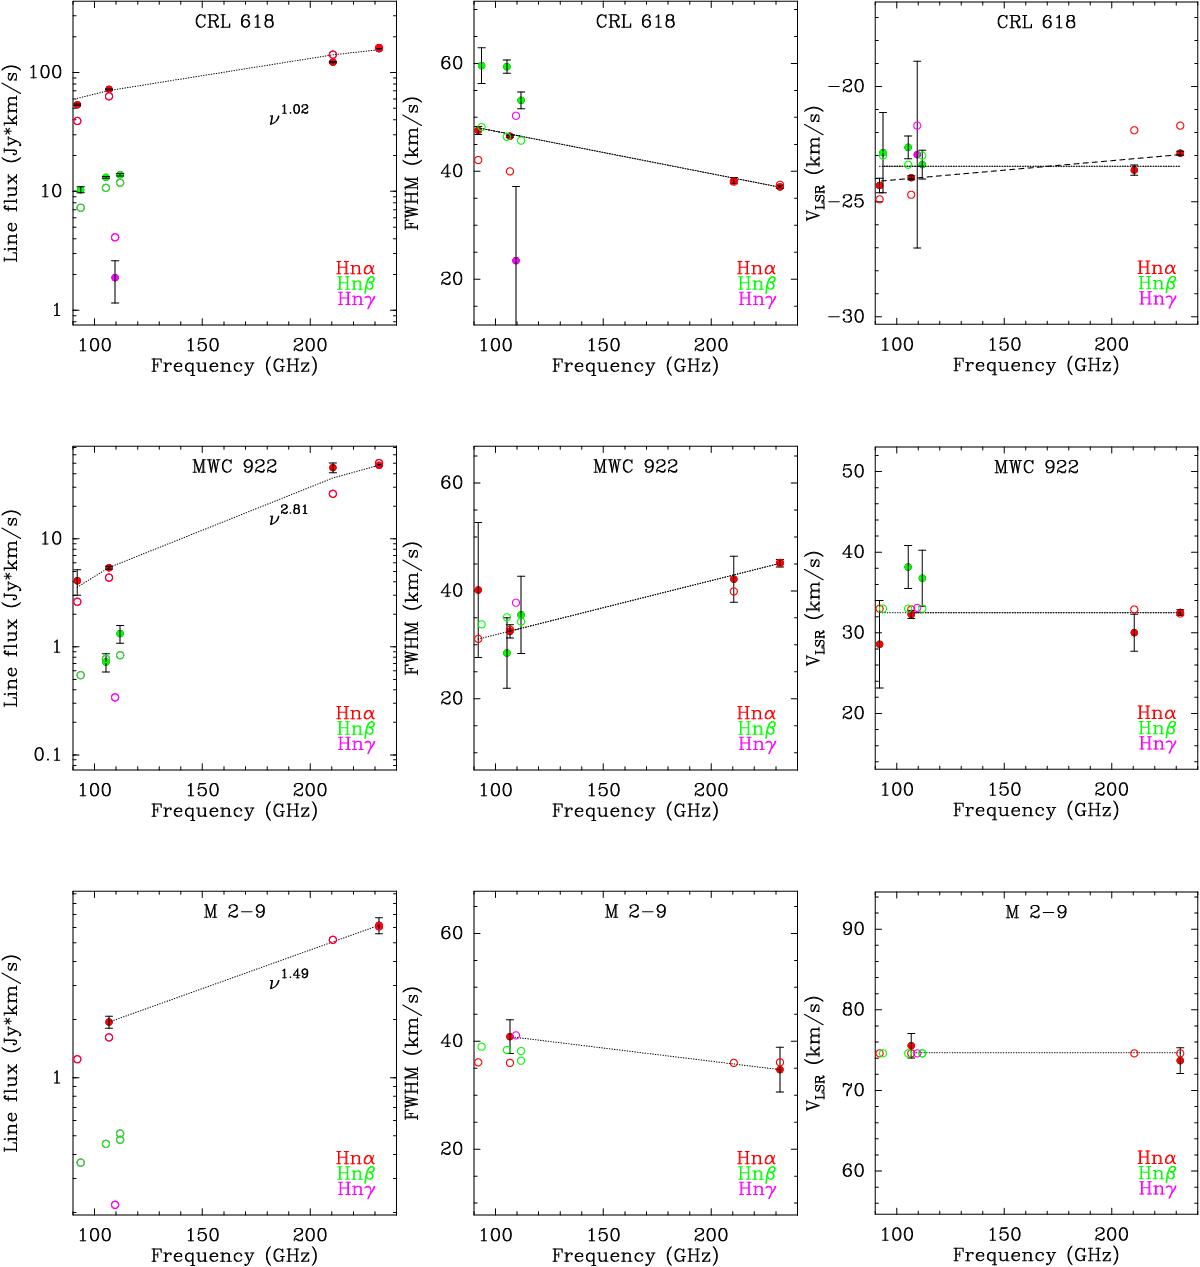
Line parameters of the RRLs detected in CRL 618, MWC 922, and M 2-9 derived from the observed profiles (Table 2; filled circles) and from the models in Table 4 including non-detections (empty circles). Dotted lines are fits to the observed line parameters of the Hnα transitions (red filled circles). For CRL 618, we show the mean VLSR of the Hnα centroids (dotted line) and a linear fit of VLSR as a function of frequency (dashed line).
Current usage metrics show cumulative count of Article Views (full-text article views including HTML views, PDF and ePub downloads, according to the available data) and Abstracts Views on Vision4Press platform.
Data correspond to usage on the plateform after 2015. The current usage metrics is available 48-96 hours after online publication and is updated daily on week days.
Initial download of the metrics may take a while.