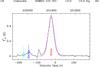
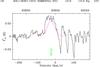
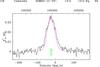
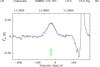
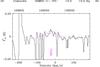
Fig. 3
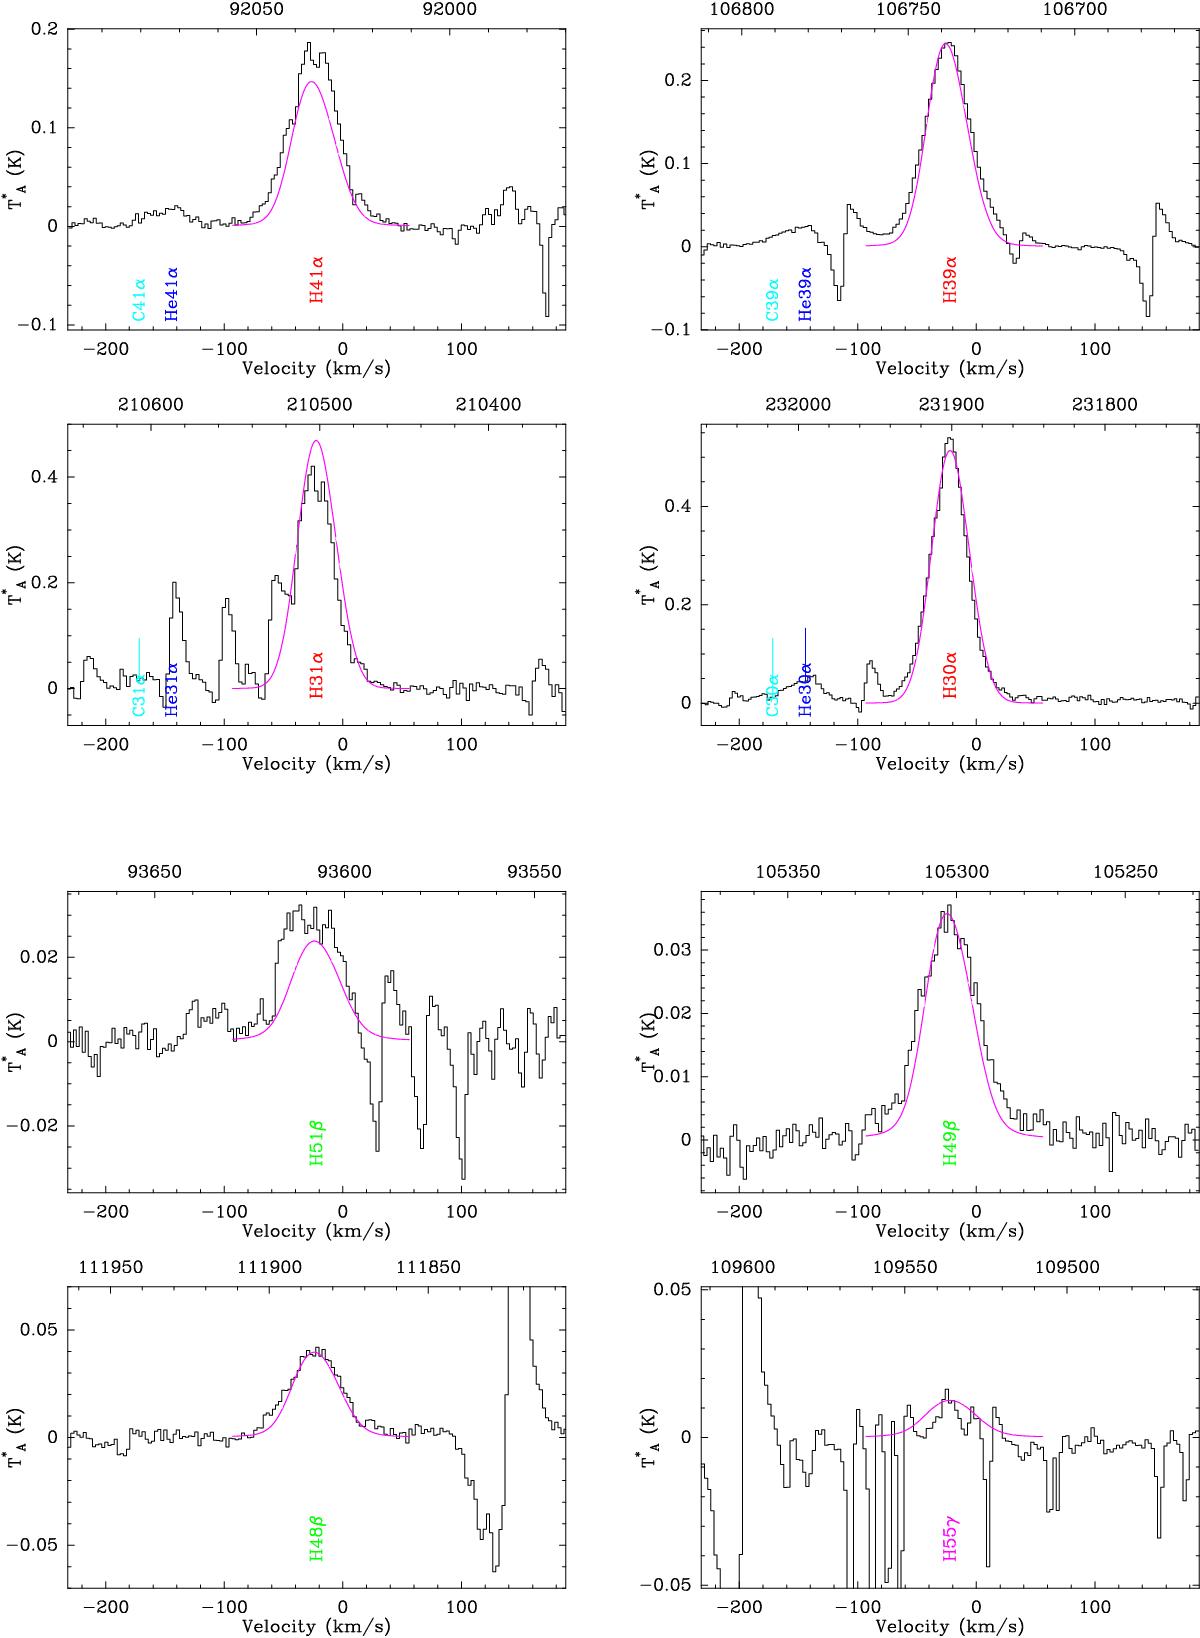
Recombination lines observed toward the pPN CRL 618 (histogram) and synthetic line profiles (pink) from our model in Table 4 (Sect. 5.1). The bottom and top X-axis represent VLSR (km s-1) and frequency (MHz). The frequency of He and C α-transitions, some of them detected, are also indicated. The many additional features observed in the spectrum, with emission and absorption profile components, are molecular transitions produced in the C-rich molecular envelope of CRL 618. Some of the mm-RRLs observed are partially blended with molecular lines.
Current usage metrics show cumulative count of Article Views (full-text article views including HTML views, PDF and ePub downloads, according to the available data) and Abstracts Views on Vision4Press platform.
Data correspond to usage on the plateform after 2015. The current usage metrics is available 48-96 hours after online publication and is updated daily on week days.
Initial download of the metrics may take a while.