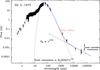
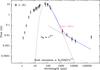
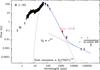
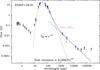
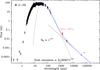
Fig. 1
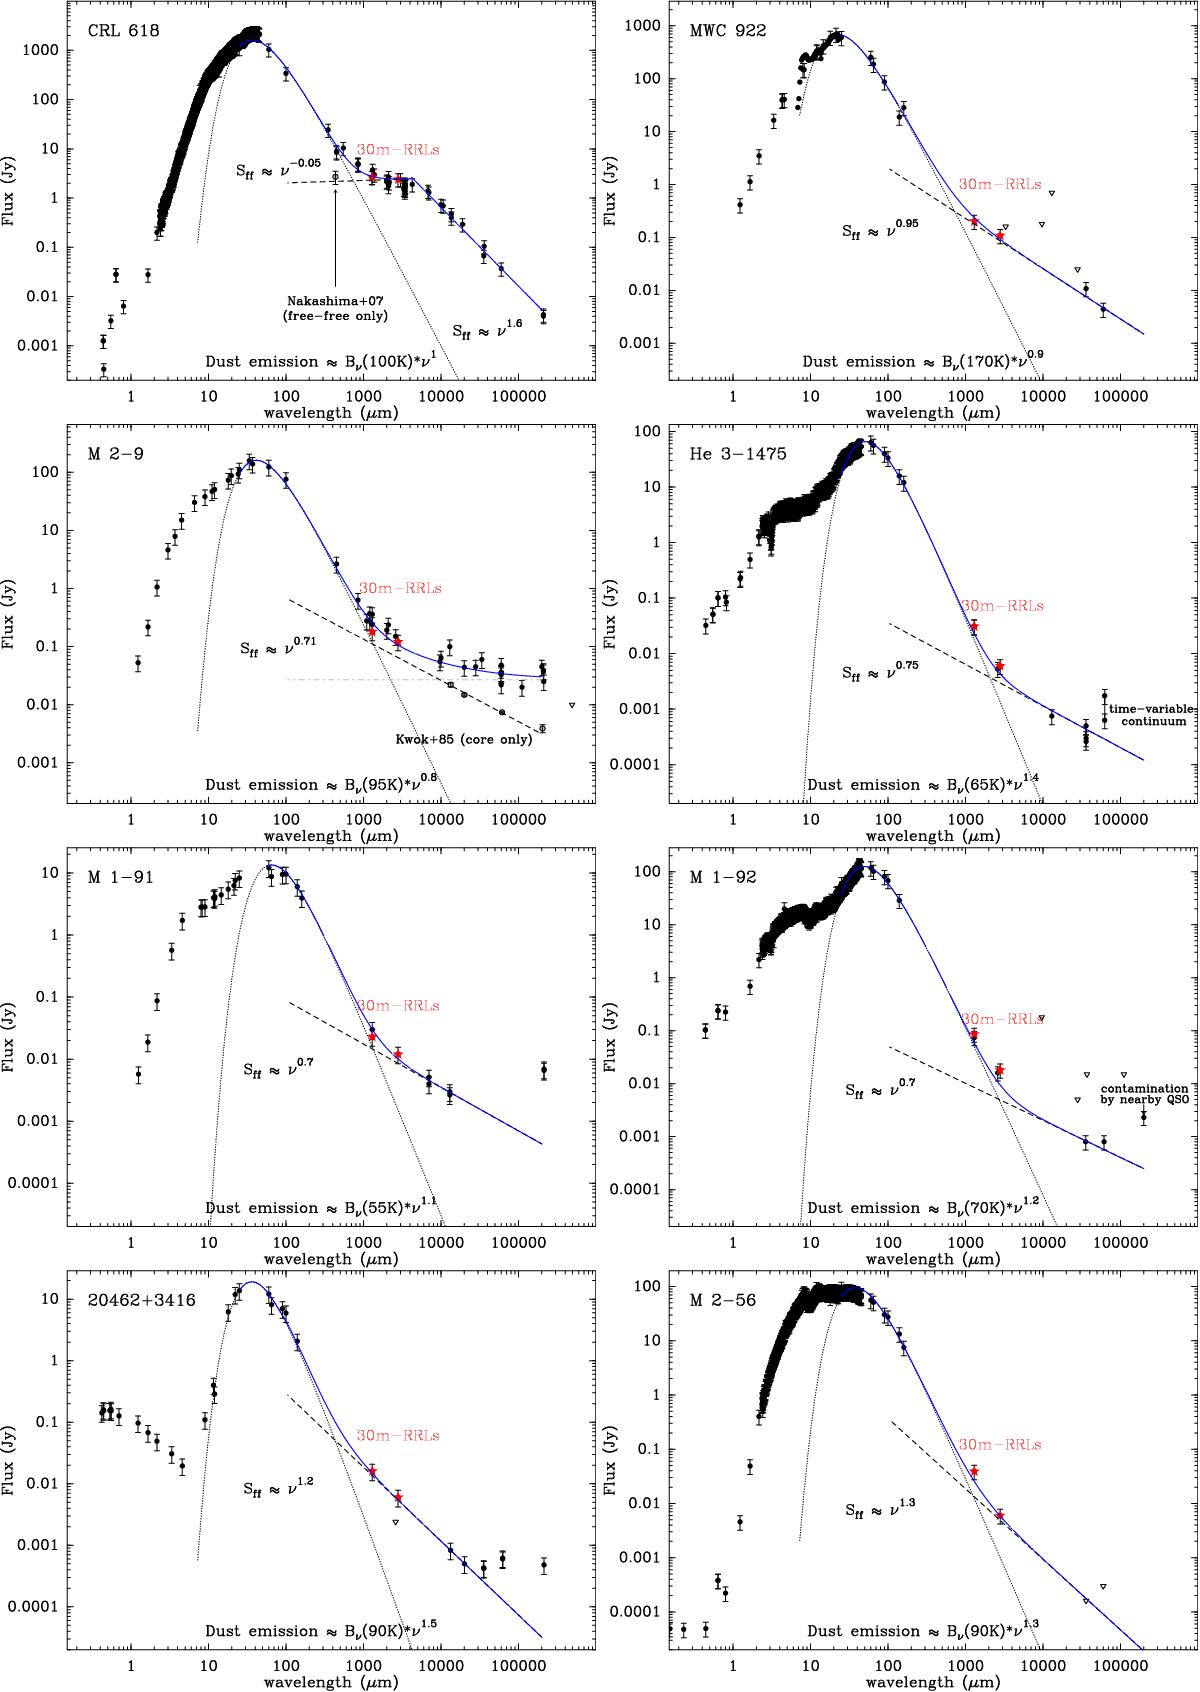
Spectral energy distributions of our targets showing literature photometry data (black circles and triangles indicate detections and upper limits, respectively) and the 1.3 and 2.7 mm continuum fluxes measured by us (star-like symbols; Table 1). The error bars represent a conservative 30% flux uncertainty assigned to all continuum data points. The dotted line indicates a modified blackbody fit to the far-IR thermal dust emission, which is subtracted from the total (dust+free-free) emission observed at mm-wavelengths. No attempt has been made to fit the warm dust emission blueward of the SED peak. The dashed line represents a fit of the type Sff ∝ να to the mm-to-cm data points. The blue solid line represents the addition of these two fits.
Current usage metrics show cumulative count of Article Views (full-text article views including HTML views, PDF and ePub downloads, according to the available data) and Abstracts Views on Vision4Press platform.
Data correspond to usage on the plateform after 2015. The current usage metrics is available 48-96 hours after online publication and is updated daily on week days.
Initial download of the metrics may take a while.