Fig. 5
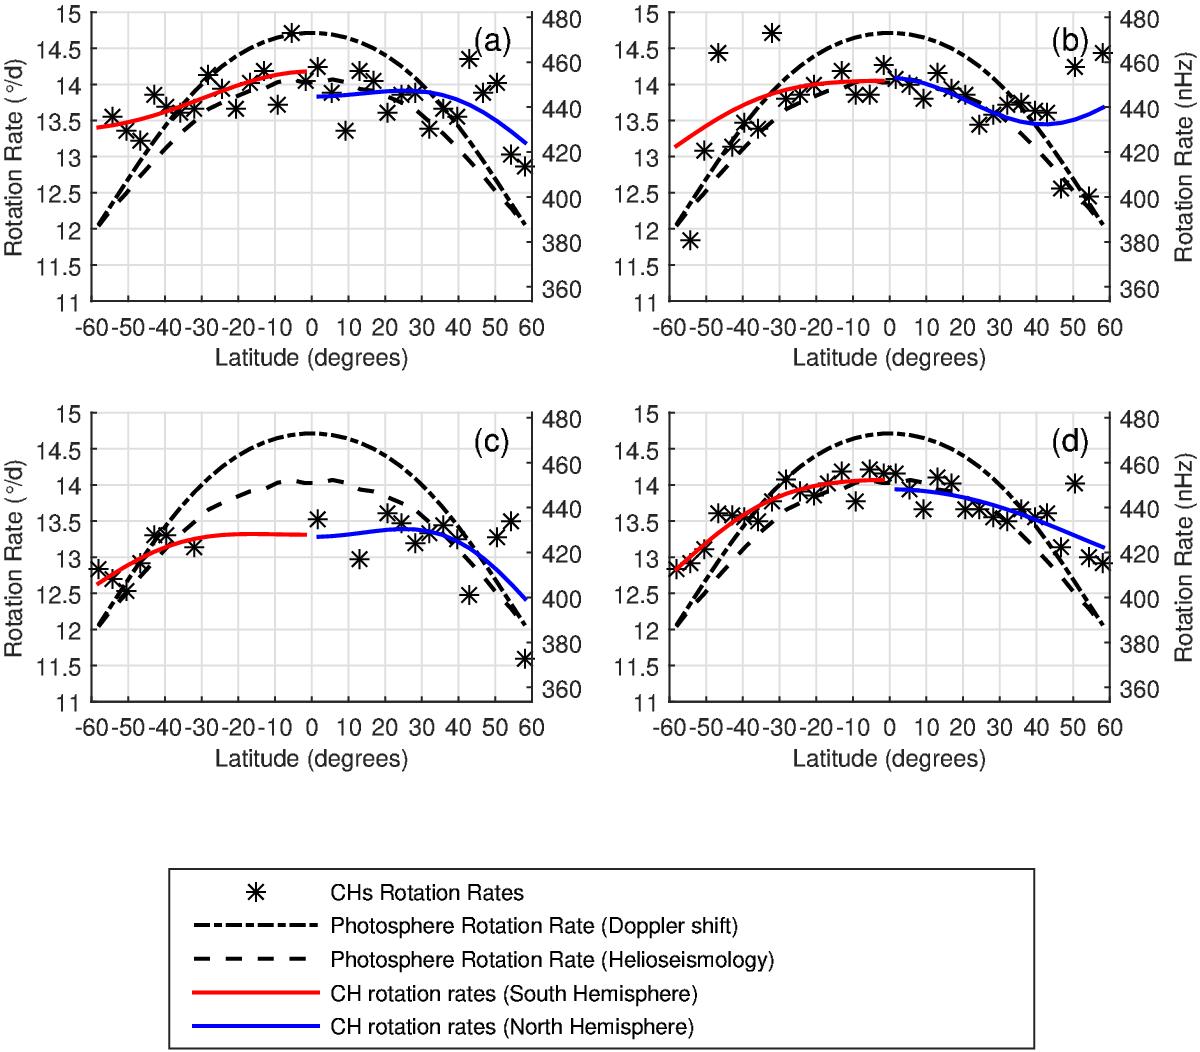
CH sidereal rotation rates for 32 latitudinal zones 3.75° wide, and their corresponding curves fitted for each hemisphere separately. The black dot-dashed line indicates the photosphere rotation rate obtained from Doppler shift measurements (Snodgrass & Ulrich 1990). The black dashed line indicates the photosphere rotation rate obtained from the helioseismology (Schou et al. 1998). The black crosses are the rotation rates of CHs for the corresponding latitudes. The red curve corresponds to the rotation profile of CHs in the southern hemisphere, while the blue curve shows the rotation profile of CHs in the northern hemisphere. Panel a) provides information about the rotation rates of CHs with areas less than 10 000 Mm2; the corresponding error bar is 0.07°/ d (2.25 nHz); panel b) shows results for CHs with areas from 10 000 to 40 000 Mm2, error = 0.1°/ d (3.22 nHz); panel c) shows results for CHs with areas greater than 40 000 Mm2, error = 0.09°/ d (2.89 nHz); and panel d) shows the results for all CHs, error = 0.07°/ d (2.25 nHz). Standard errors are calculated as σ/![]() for each area group.
for each area group.
Current usage metrics show cumulative count of Article Views (full-text article views including HTML views, PDF and ePub downloads, according to the available data) and Abstracts Views on Vision4Press platform.
Data correspond to usage on the plateform after 2015. The current usage metrics is available 48-96 hours after online publication and is updated daily on week days.
Initial download of the metrics may take a while.