Fig. 9
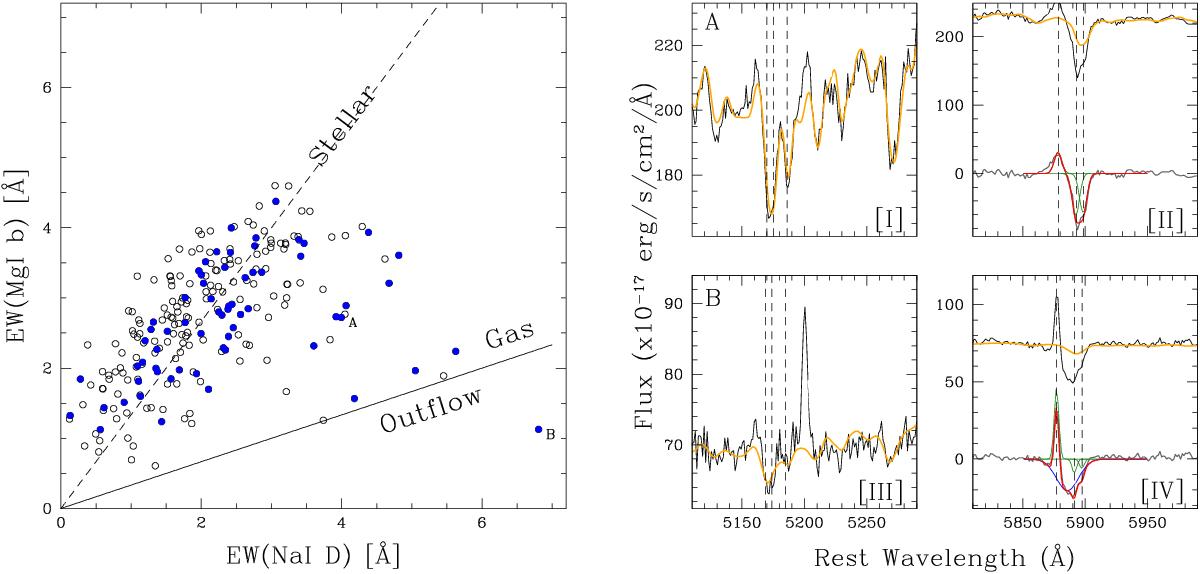
Left: EW of the Na I D vs. Mg I b absorption lines. Open black and solid blue points represents sources with and without ionized outflows respectively (i.e. Vmax ≶ 650 km s-1). The dashed line indicates the ratio at which the sodium is expected on the basis of observed magnesium EW (Heckman et al. 2000); the solid line indicates the starburst-driven outflow region proposed by Rupke et al. (2005a). The letters A and B indicate the sources for which the spectra are shown on the right. Right: SDSS spectra of J113240.24+525701.3 and MKN 848 (indicated with the letters A and B in the diagnostic diagram) around the Mg I b (left panels) and Na I D (right panels) absorption features. Orange curves show the best-fit pPXF results. Vertical lines represent the systemic of Mg I b triplet ([I] and [III] panels), and He I and Na I D doublet ([II] and [IV] panels). Panels [II] and [IV] show our fit results. Green, blue, and red curves represent the NC, OC, and the total best-fit model, respectively.
Current usage metrics show cumulative count of Article Views (full-text article views including HTML views, PDF and ePub downloads, according to the available data) and Abstracts Views on Vision4Press platform.
Data correspond to usage on the plateform after 2015. The current usage metrics is available 48-96 hours after online publication and is updated daily on week days.
Initial download of the metrics may take a while.