Fig. 8
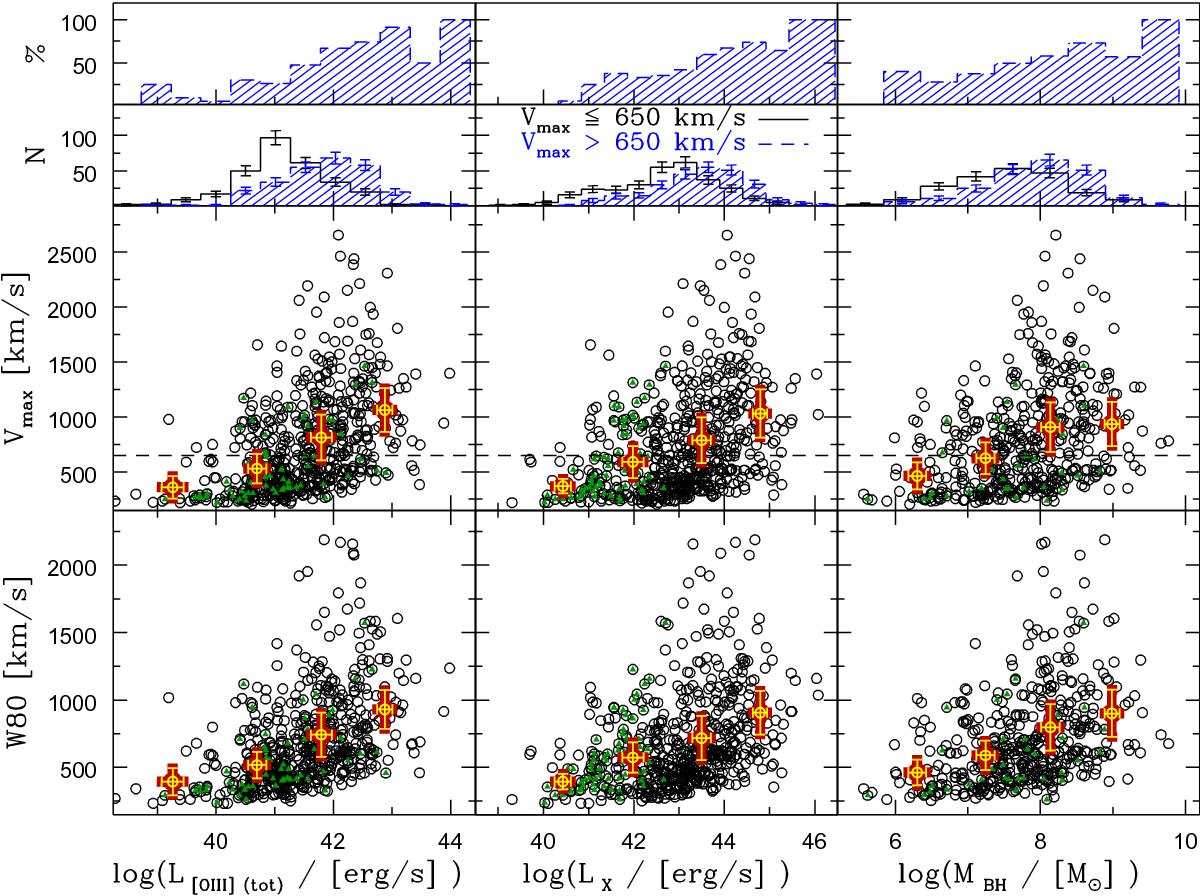
Central and bottom panels: non-parametric velocity W80 and Vmax estimators as a function of [O III] (left) and intrinsic 2–10 keV X-ray (central) luminosity, as well as a function of the black hole mass for the BL AGN subsample. Red/yellow dots represent average velocity in bin of luminosity; bars indicate uncertainties of the averages. Green dots indicate faint X-ray sources for which the intrinsic LX has been inferred using HR ratio corrections (see text). Top panels: fraction of AGNs with Vmax> 650 km s-1 (blue dashed line; first panel from the top) and distributions of Vmax< 650 km s-1 (black line) and Vmax> 650 km s-1 (blue dashed line; second panel from the top) as a function of [O III] (left), X-ray (central) luminosity, and MBH (right).
Current usage metrics show cumulative count of Article Views (full-text article views including HTML views, PDF and ePub downloads, according to the available data) and Abstracts Views on Vision4Press platform.
Data correspond to usage on the plateform after 2015. The current usage metrics is available 48-96 hours after online publication and is updated daily on week days.
Initial download of the metrics may take a while.