Fig. 7
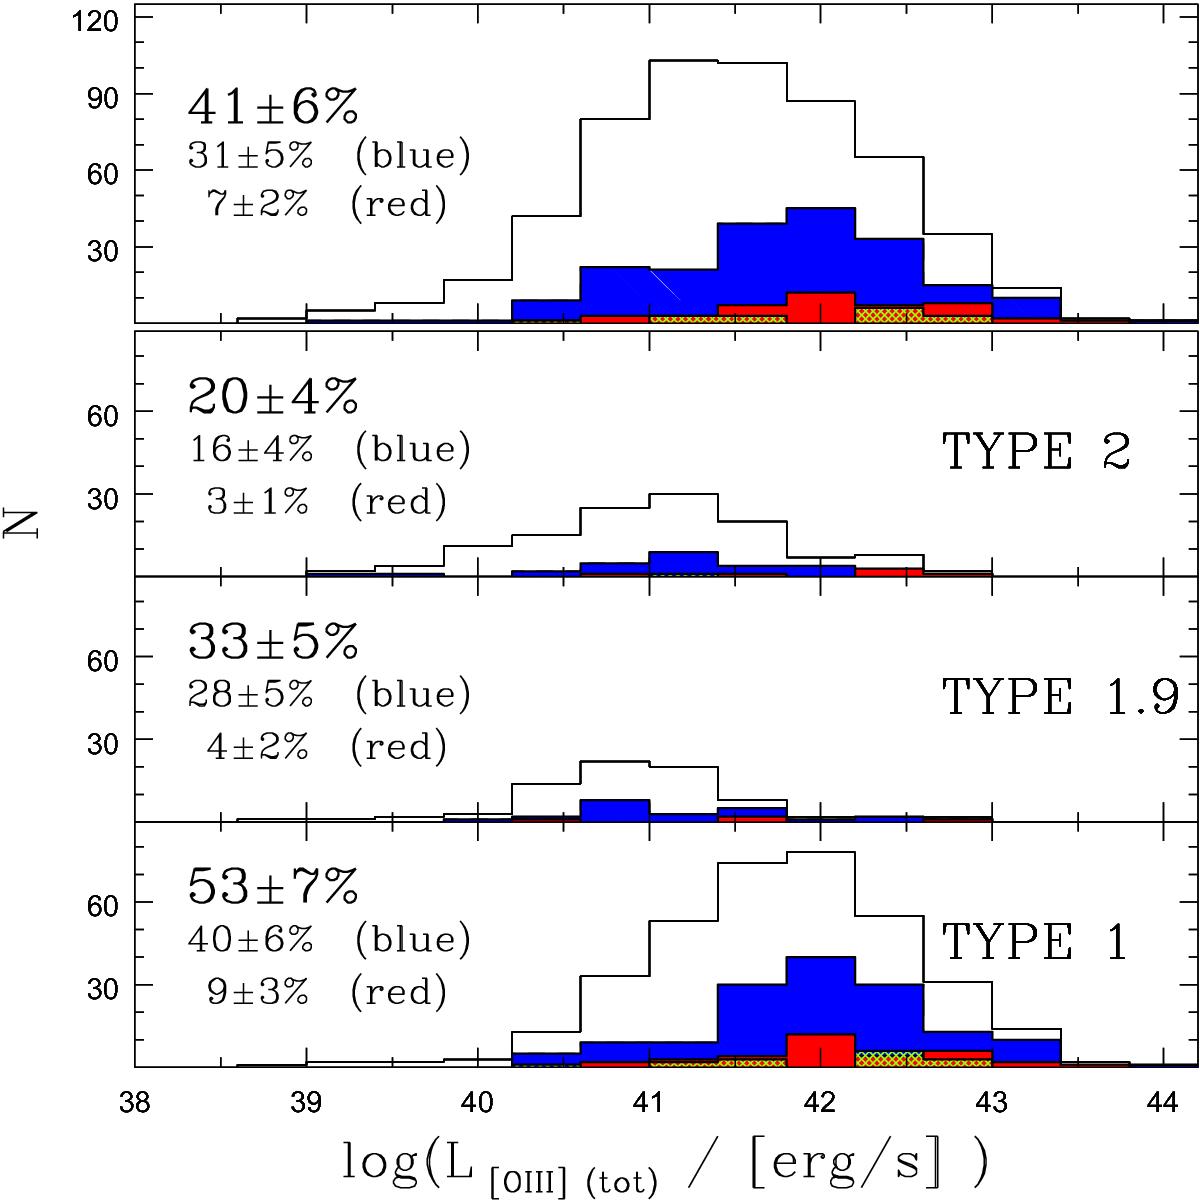
Distributions of sources with ionized outflows as a function of the [O III] luminosity. The top panel shows the velocity distribution for approaching, receding, and symmetric outflows represented with blue, red, and green histograms, respectively. The lower panels show same distributions for subsamples defined on the basis of the AGN type. For each panel, the fraction of AGNs with outflow is highlighted, together with the fraction of receding and approaching outflows.
Current usage metrics show cumulative count of Article Views (full-text article views including HTML views, PDF and ePub downloads, according to the available data) and Abstracts Views on Vision4Press platform.
Data correspond to usage on the plateform after 2015. The current usage metrics is available 48-96 hours after online publication and is updated daily on week days.
Initial download of the metrics may take a while.