Fig. 6
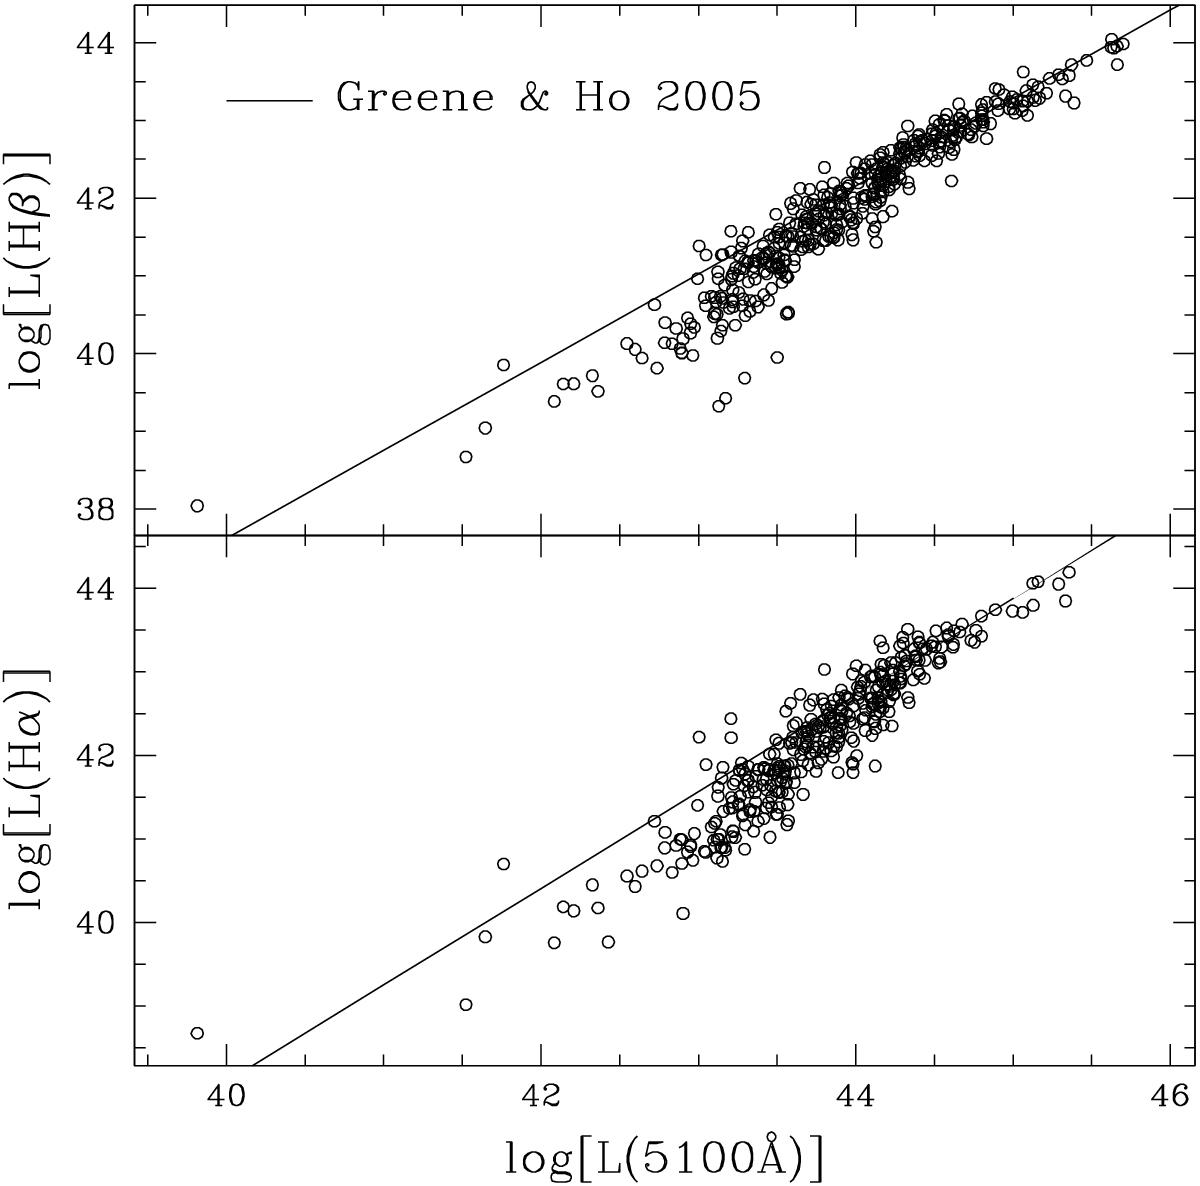
Correlations of LHα − (bottom panel) and L(Hβ) − L(5100 Å) (bottom). The solid lines represent the Greene & Ho (2005) correlations obtained from a sample of type 1 AGN with low galaxy contribution in the optical continuum emission. A significant displacement from such relations is found for our low-luminosity AGN subsample, in which the continuum emission at 5100 Å is dominated by host galaxy emission.
Current usage metrics show cumulative count of Article Views (full-text article views including HTML views, PDF and ePub downloads, according to the available data) and Abstracts Views on Vision4Press platform.
Data correspond to usage on the plateform after 2015. The current usage metrics is available 48-96 hours after online publication and is updated daily on week days.
Initial download of the metrics may take a while.