Fig. 5
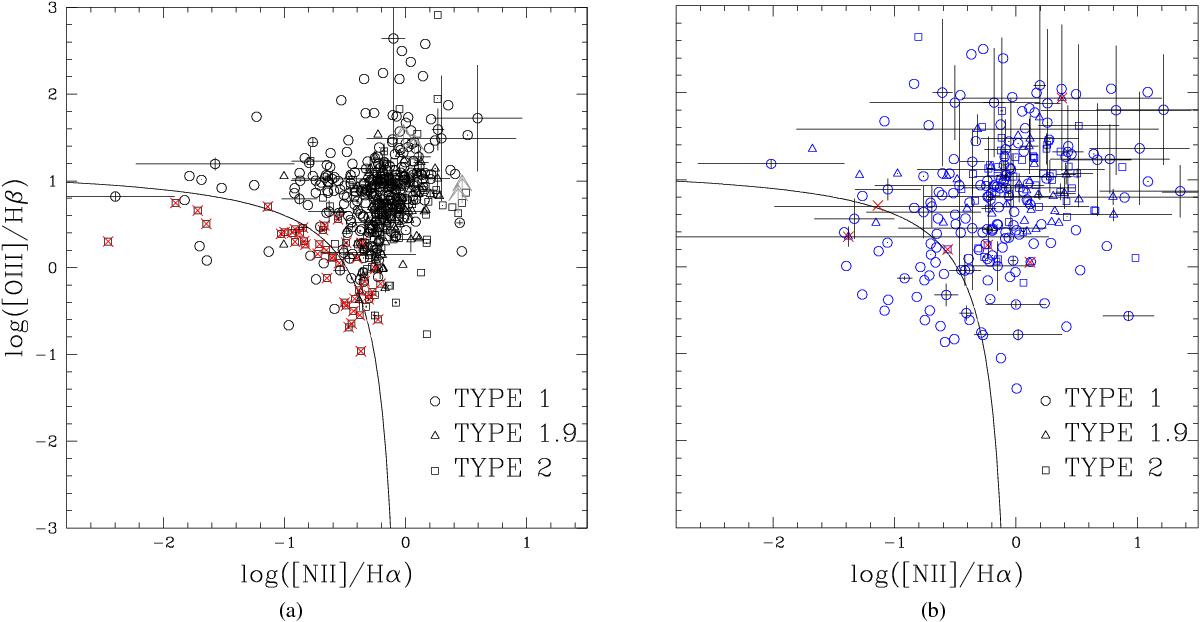
BPT diagrams – standard diagnostic diagram showing the classification scheme by Kewley et al. (2013). The lines drawn in the diagram correspond to the theoretical redshift-dependent curves at z = 0 used to separate purely SF galaxies from galaxies containing AGN. Black (left panel) and blue (right panel) symbols correspond to the systemic NC and outflow OC flux ratios, respectively. Representative error bars are shown only for a small fraction of targets. Circles, squares, and triangles denote Type 1, type 2, and type 1.9 AGNs, respectively. Red crosses highlight the SF galaxies discarded from the sample, using the NC flux ratios (see text for details). Grey upper arrows represent lower limits due to an undetected Hβ emission line.
Current usage metrics show cumulative count of Article Views (full-text article views including HTML views, PDF and ePub downloads, according to the available data) and Abstracts Views on Vision4Press platform.
Data correspond to usage on the plateform after 2015. The current usage metrics is available 48-96 hours after online publication and is updated daily on week days.
Initial download of the metrics may take a while.