Fig. 4
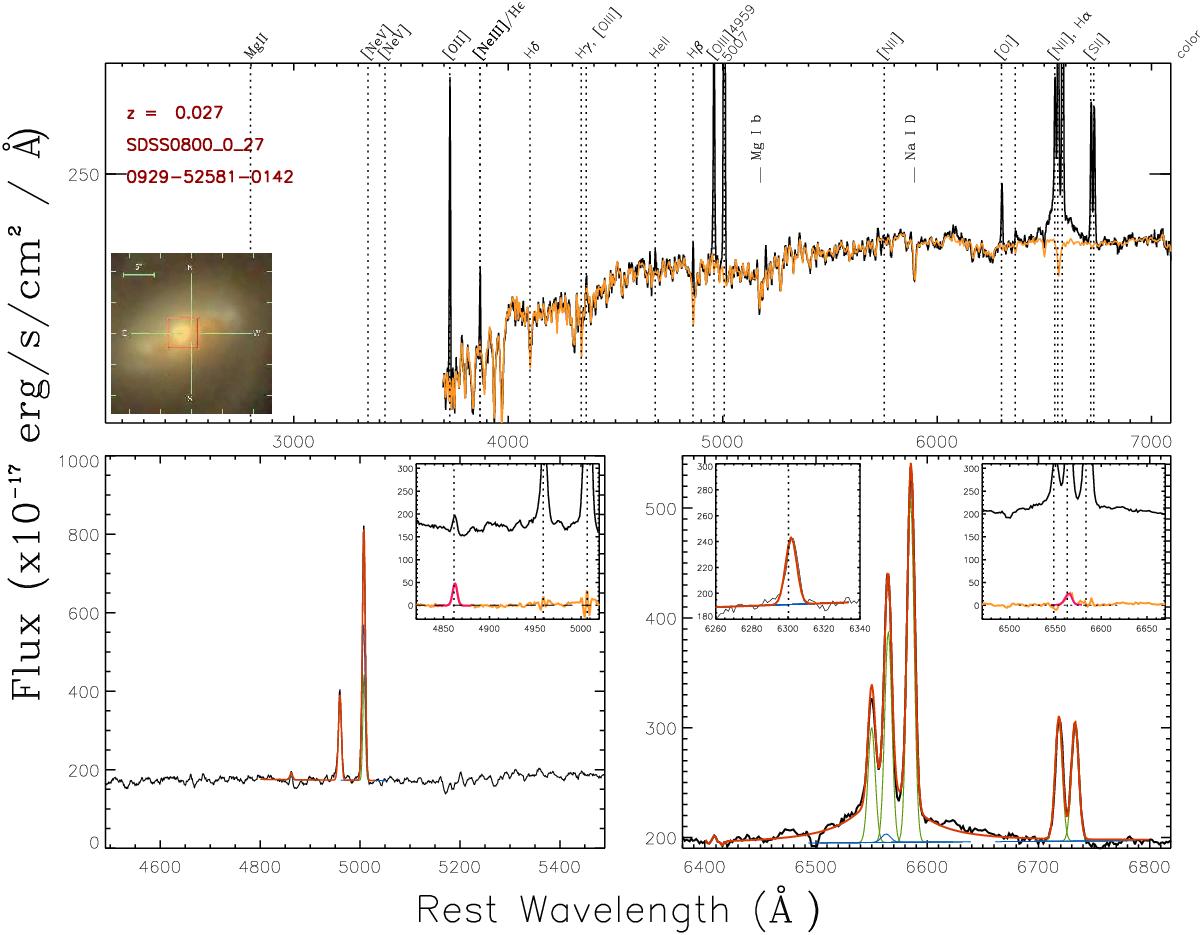
Top panels: pPXF best-fit model results for a type 1.9 AGN (orange curve) superimposed on the rest-frame SDSS spectrum. All the prominent emission lines and analysed features are highlighted with vertical dotted lines; the positions of Mg I b and Na I D absorption lines are also indicated. The inset on the left shows the SDSS colour-composite cut-out of the galaxy with a red square indicating the spatial region from which the 3′′ spectrum was obtained. Bottom panels: fit results from the multicomponent simultaneous fit in the Hβ-[O III] (left) and Hα-[NII] (right) regions. Green and blue curves show the NC and OC Gaussian profiles, while the red lines represent the total best-fit profile. The insets on the right of each panel show the excess in the Balmer emission lines found after the correction for the pPXF best-fit model (the orange curves represent the difference between the SDSS spectrum and pPXF and simultaneous fit models). The original spectrum is also shown for a qualitative evaluation of the contribution of stellar absorption feature in the observed emission line. Magenta Gaussian profiles represent best-fit results associated with significant (>5σ) residuals. The insets on the left of the Hα+[N II] panels show the best-fit models of [O I]λ6300.
Current usage metrics show cumulative count of Article Views (full-text article views including HTML views, PDF and ePub downloads, according to the available data) and Abstracts Views on Vision4Press platform.
Data correspond to usage on the plateform after 2015. The current usage metrics is available 48-96 hours after online publication and is updated daily on week days.
Initial download of the metrics may take a while.