Fig. 3
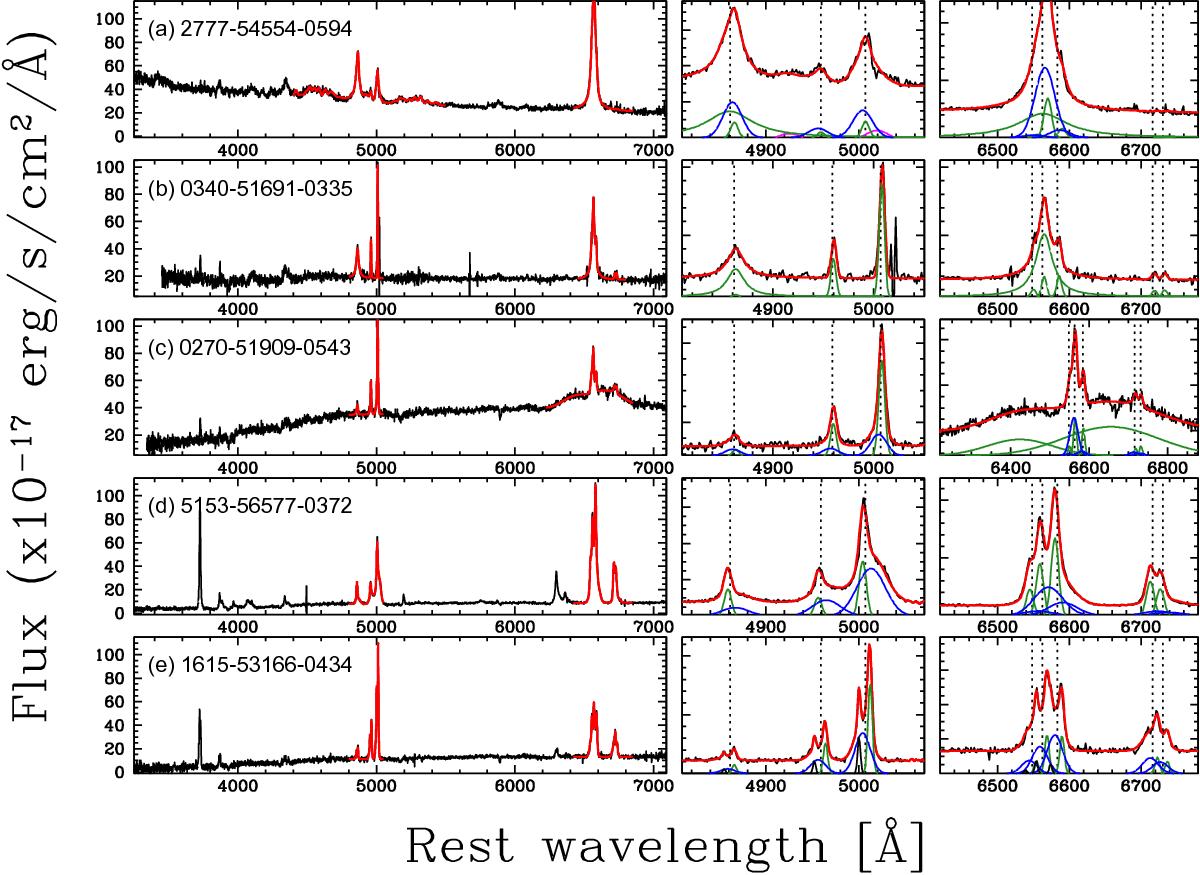
Five examples of spectra illustrating our fitting method. For each object, we show on the left the spectrum (black curve) and the best-fit model (red curve). Central and right panels show the zoomed regions around the Hβ and Hα emission, respectively. The dashed vertical lines indicate the location of Hβ, [O III] doublet, Hα, [N II], and [S II] doublets. Best-fit NC and BC profiles are highlighted with green curves (panels a) to e)); OC and Fe II emission are shown with blue (panels a) to e)) and magenta (panel a)) curves, respectively. Finally, black Gaussian profiles (in panel e)) show a second set of NC used to fit doublet peaked galaxies. In the rows the spectra of various AGN types are shown. From top to bottom, the plots represent a) a blue spectrum of a type 1 AGN with broad BLR Lorentzian profiles, Fe II emission, and blue wings associated with outflows; b) a reddened type 1 AGN without evidence of outflow; c) a low-luminosity broad line AGN, whose continuum is dominated by stellar emission, in which we observe a complex BLR Hα profile, modelled with two strong BC and no BLR Hβ emission; d) a candidate type 2 AGN without evidence of BLR emission but with strong emission from outflowing gas detected for all the optical emission lines; and e) a candidate type 2 AGN with double peaked emission lines and an outflow component.
Current usage metrics show cumulative count of Article Views (full-text article views including HTML views, PDF and ePub downloads, according to the available data) and Abstracts Views on Vision4Press platform.
Data correspond to usage on the plateform after 2015. The current usage metrics is available 48-96 hours after online publication and is updated daily on week days.
Initial download of the metrics may take a while.