Fig. C.1
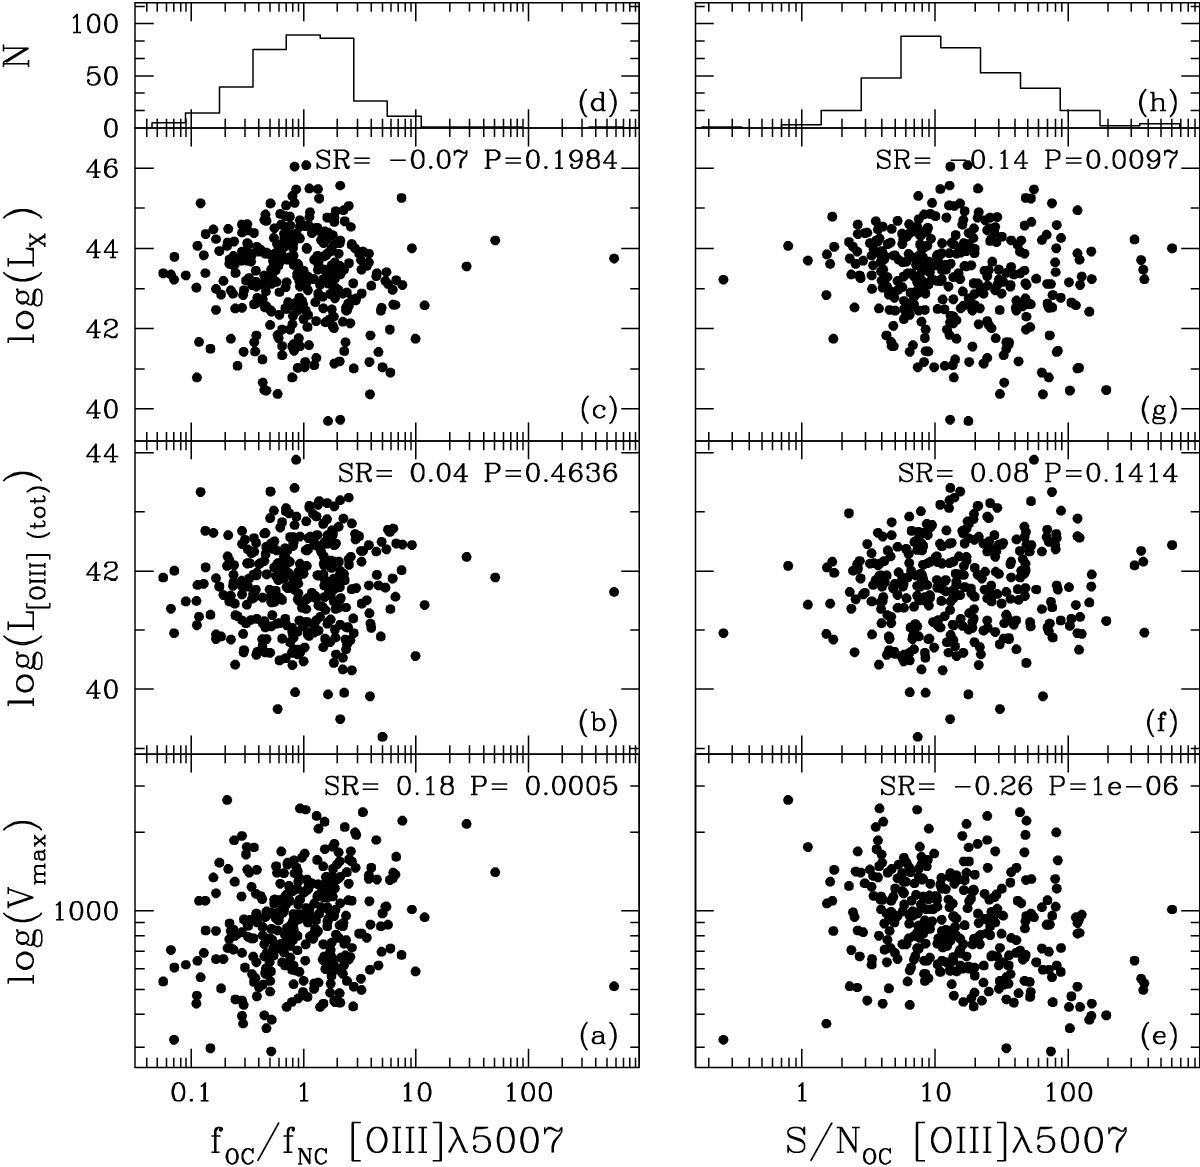
OC/NC flux ratios and [O III]λ5007 OC signal to noise (S/NOC) as a function of Vmax, [O III] and X-ray luminosities for the subsample modelled with NC+OC Gaussians. Spearman rank coefficients and null hypothesis probabilities are also labelled in each panel. The panels in the first row indicate the distributions of OC/NC ratios and S/NOC.
Current usage metrics show cumulative count of Article Views (full-text article views including HTML views, PDF and ePub downloads, according to the available data) and Abstracts Views on Vision4Press platform.
Data correspond to usage on the plateform after 2015. The current usage metrics is available 48-96 hours after online publication and is updated daily on week days.
Initial download of the metrics may take a while.