Fig. A.1
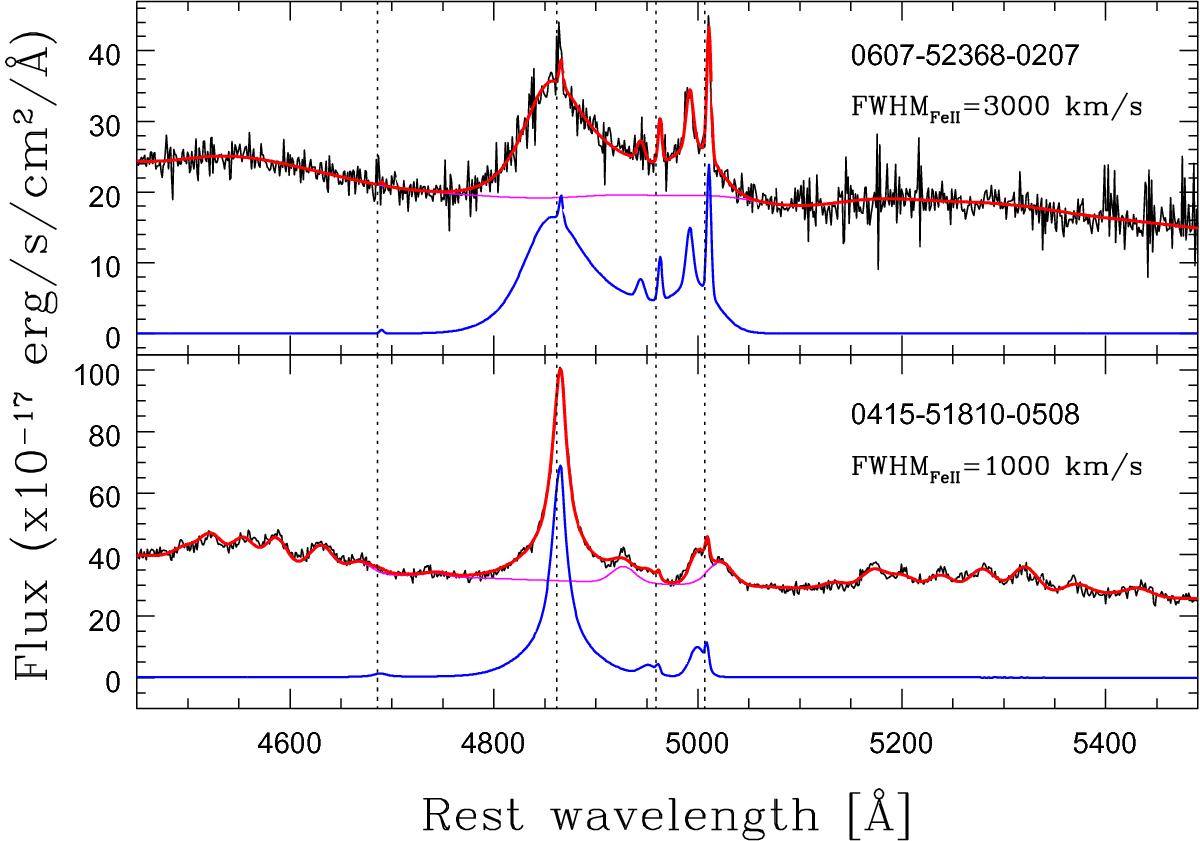
Multicomponent simultaneous best-fit results (red curves) for two X-ray/SDSS sources showing iron emission and double peaked [O III] profiles. Black profiles represent rest-frame SDSS spectra. Blue and magenta curves indicate the best-fit results for the [O III]-Hβ emission and for the Fe II lines, respectively. For visual inspection, the iron profile is added to the power-law continuum. The figure shows the deconvolution between Fe II and the reddest emission from [O III]. We labelled in the panels the MJD, the plate, and the fibre numbers, which uniquely identifies the SDSS spectra and FWHM required to fit the iron emission.
Current usage metrics show cumulative count of Article Views (full-text article views including HTML views, PDF and ePub downloads, according to the available data) and Abstracts Views on Vision4Press platform.
Data correspond to usage on the plateform after 2015. The current usage metrics is available 48-96 hours after online publication and is updated daily on week days.
Initial download of the metrics may take a while.