Fig. 10
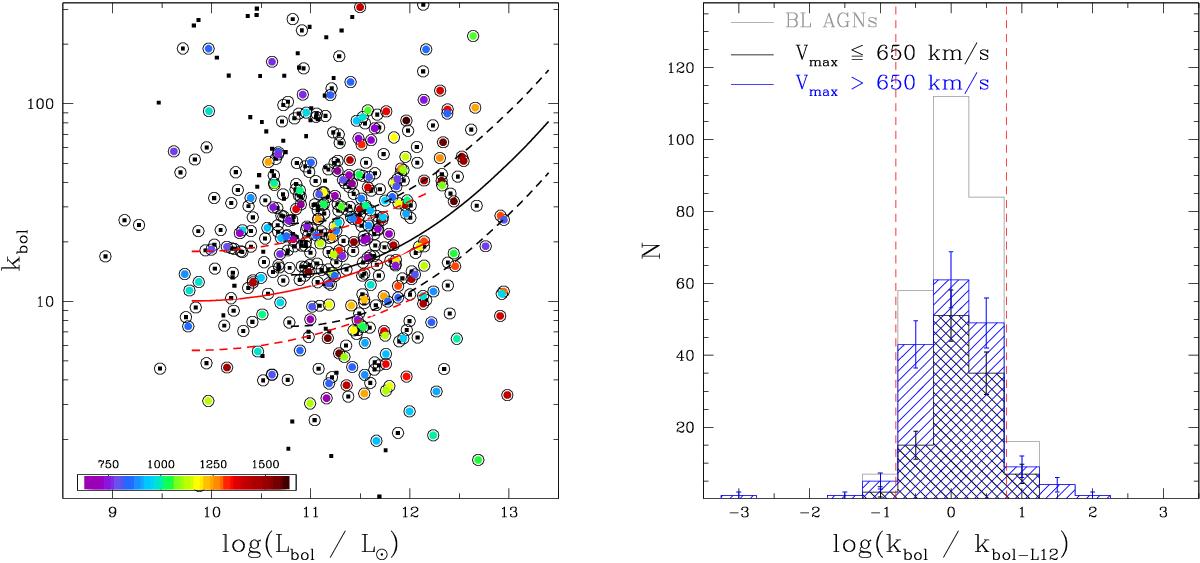
Left panel: plot of kbol vs. Lbol. Black square symbols represent type 2 AGNs, while colour-coded circles indicate the type 1 and type 1.9 sources for increasing outflow velocity. The black and red curves represent the best-fitting relations obtained by Lusso et al. (2012) for type 1 and type 2 AGNs in the COSMOS field, respectively. Right: distribution of the normalized (in log space) kbol values with respect to those expected from the relation for X-ray selected AGNs (black curve in the left panel) for the BL X-ray/SDSS sample (grey histogram). Blue and black histograms represent the distributions for sources with and without outflow signatures. Error bars indicate Poissonian errors. For comparison, 3 × σ dispersion values derived by Lusso et al. (2012) for XMM-COSMOS sources are also shown with red dashed vertical lines.
Current usage metrics show cumulative count of Article Views (full-text article views including HTML views, PDF and ePub downloads, according to the available data) and Abstracts Views on Vision4Press platform.
Data correspond to usage on the plateform after 2015. The current usage metrics is available 48-96 hours after online publication and is updated daily on week days.
Initial download of the metrics may take a while.