Fig. 1
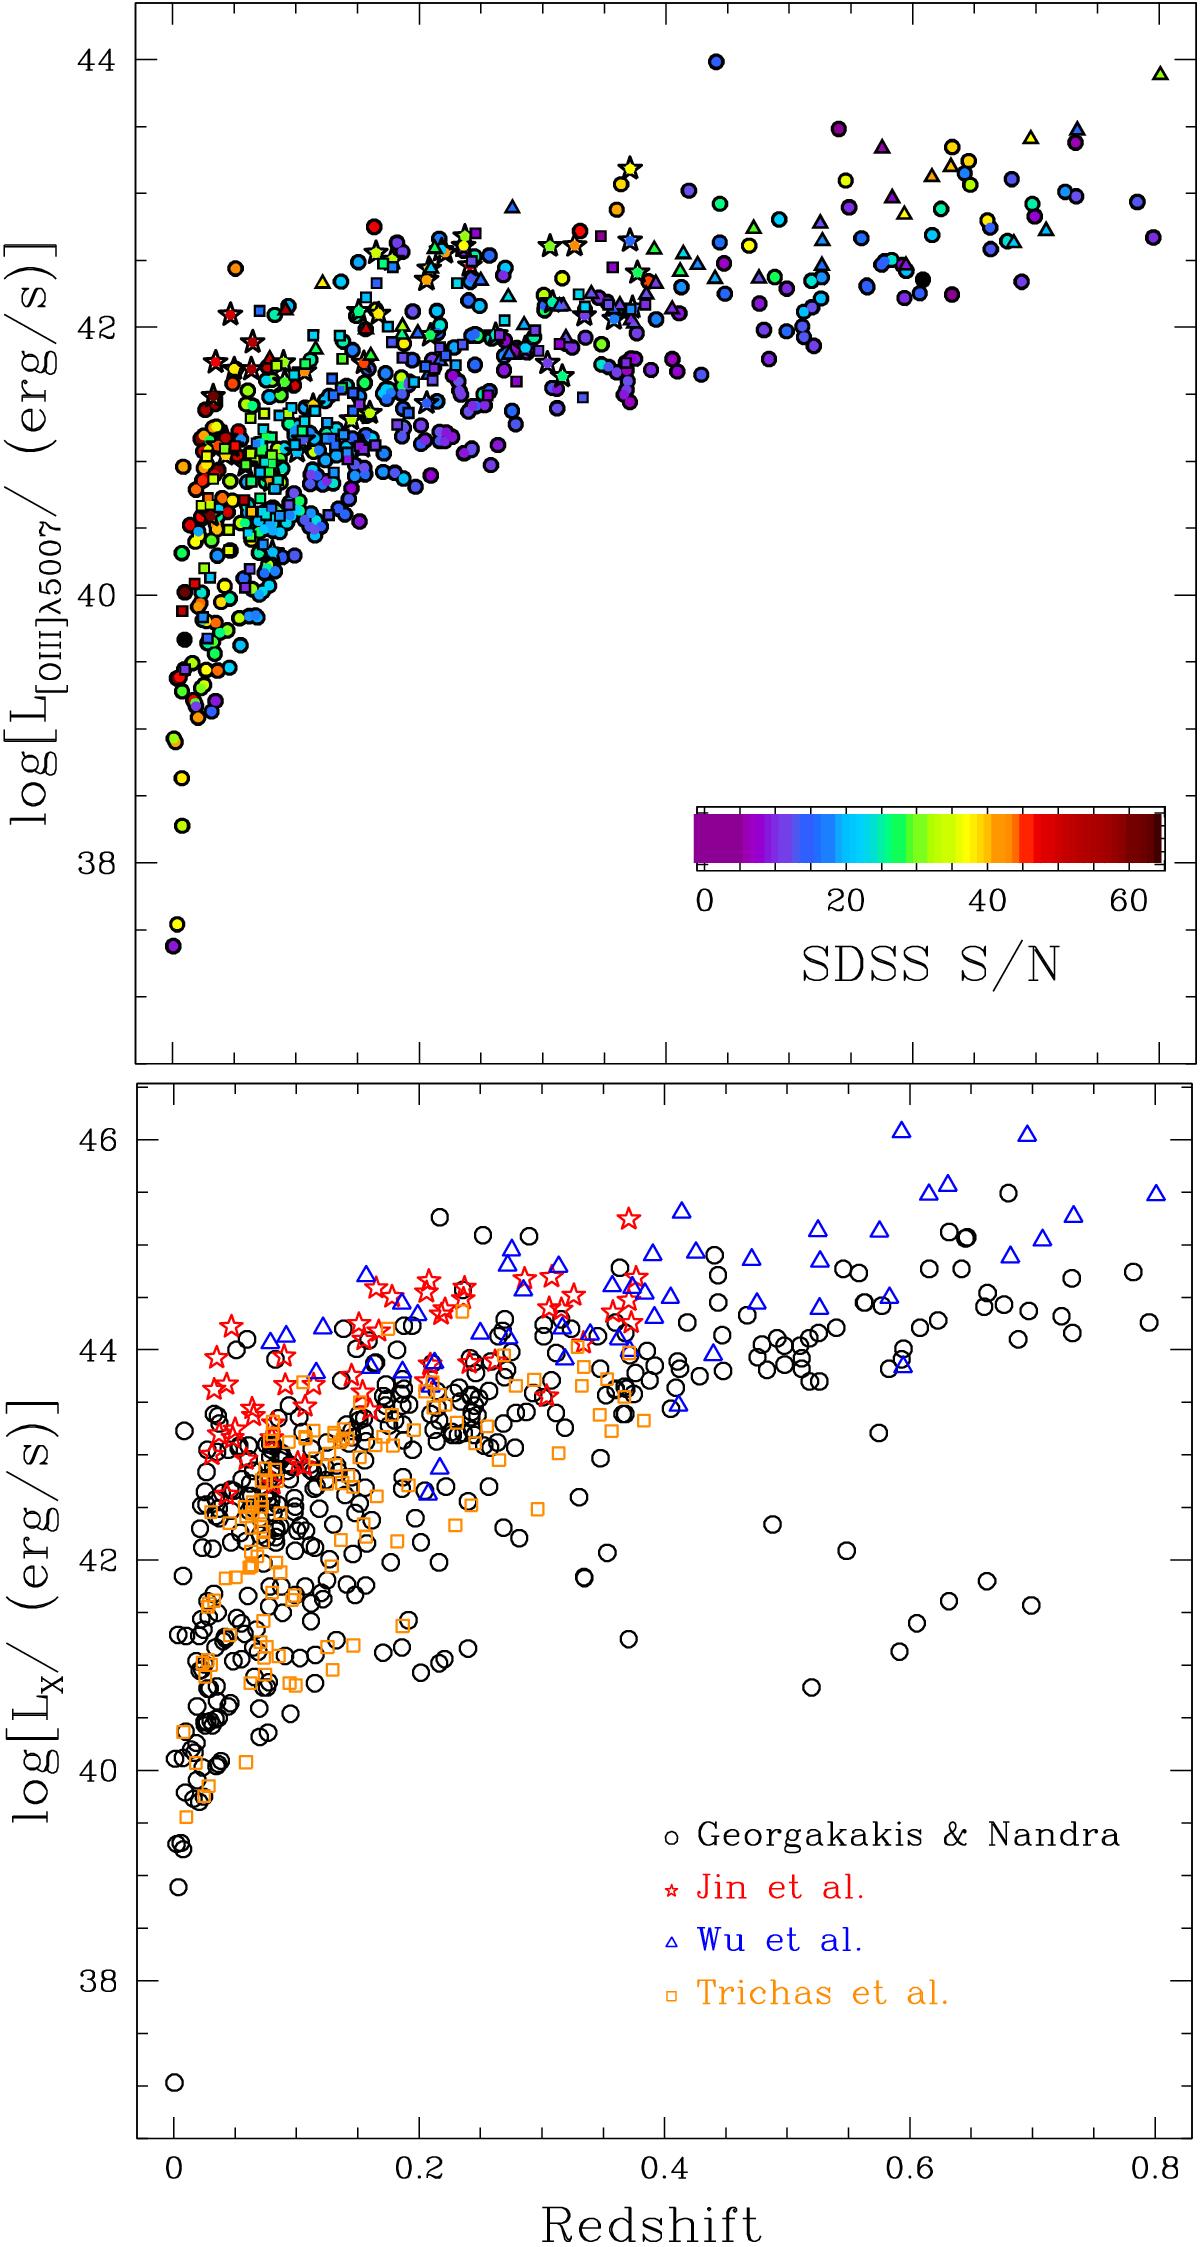
Top panel: [O III]λ5007 total luminosity as obtained by our spectral analysis vs. redshift for the 624 candidate AGNs coloured by nominal SDSS S/N, as labelled in the colour bar. Circles, stars, triangles, and squares refer to Georgakakis & Nandra (2011), Jin et al. (2012), Wu et al. (2012), Trichas et al. (2013) subsamples, respectively, used to construct our X-ray/SDSS sample. Bottom panel: absorption corrected X-ray luminosity vs. redshift for the same sample of targets, distinguishing between the different subsamples, as labelled in the figure.
Current usage metrics show cumulative count of Article Views (full-text article views including HTML views, PDF and ePub downloads, according to the available data) and Abstracts Views on Vision4Press platform.
Data correspond to usage on the plateform after 2015. The current usage metrics is available 48-96 hours after online publication and is updated daily on week days.
Initial download of the metrics may take a while.