Fig. 9
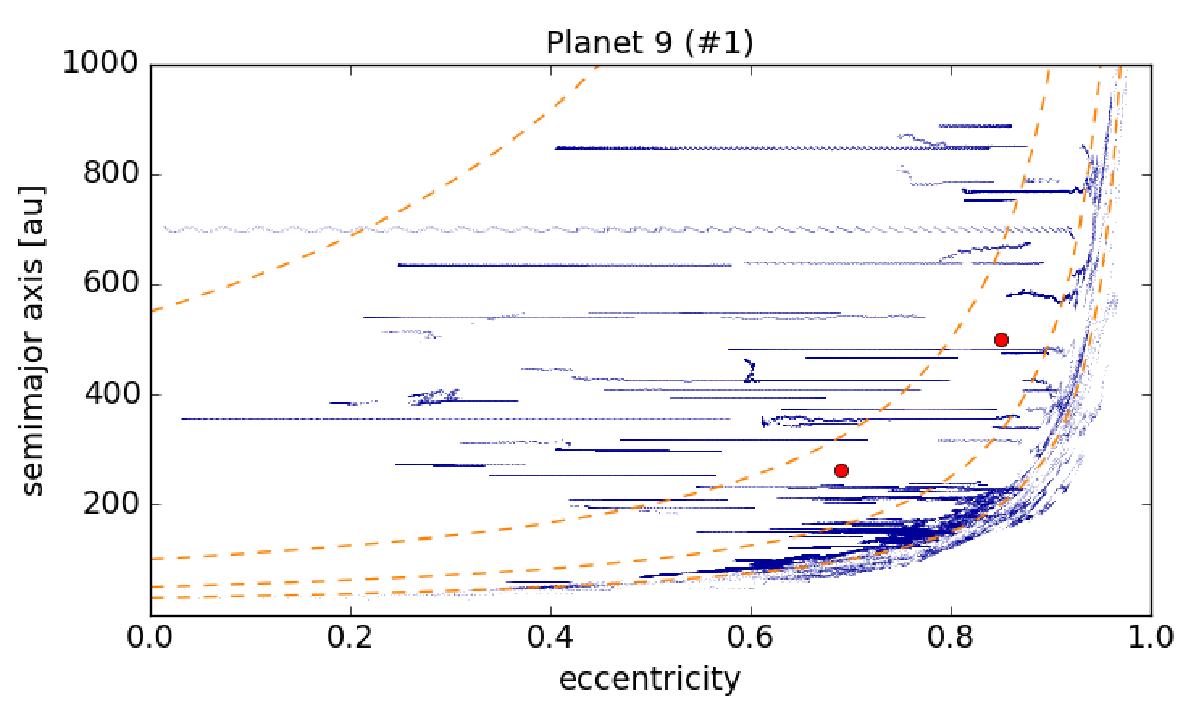
a−e diagram from the last Gyr of the P9 simulation incorporating gravitational interaction with Neptune. Only evolution of test particles in orbits with inclinations spanning i ∈ (10,30) deg, which is the interval that the inclinations of Sednoids lie in, is shown. Sedna and 2012 VP 113 are indicated as large dots. The dashed lines indicate q = 30, 50, 100, and 550 au levels (from right/bottom to left/upwards).
Current usage metrics show cumulative count of Article Views (full-text article views including HTML views, PDF and ePub downloads, according to the available data) and Abstracts Views on Vision4Press platform.
Data correspond to usage on the plateform after 2015. The current usage metrics is available 48-96 hours after online publication and is updated daily on week days.
Initial download of the metrics may take a while.