Fig. 7
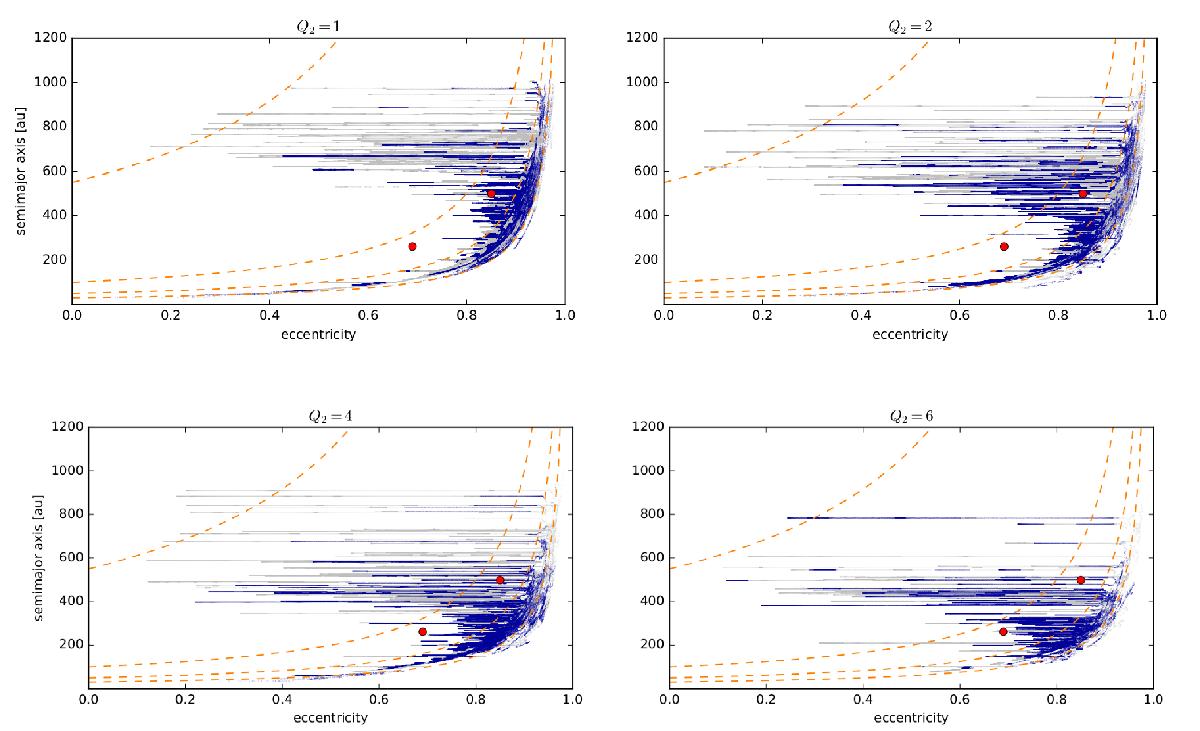
a−e diagram from the last Gyr of the benchmark model simulation incorporating gravitational interaction with Neptune. Q2 = 1 (top left panel), Q2 = 2 (top right panel), Q2 = 4 (bottom left panel), and Q2 = 6 (bottom right panel) were assumed. Two colours (transparency levels) are used as a proxy for two inclination ranges. The blue (less transparent) evolutionary tracks represent orbits with inclinations spanning i ∈ (10,30) deg, the interval the inclinations of Sednoids lie in. The grey (more transparent) tracks refer to all the other long-living orbits. Sedna and 2012 VP 113 are indicated as large dots. The dashed lines indicate q = 30, 50, 100, and 550 au levels (from right/bottom to left/upwards). Objects between the two left-most/upper-most lines (q in range between 100 and 550 au) would hardly be observed if they really exist.
Current usage metrics show cumulative count of Article Views (full-text article views including HTML views, PDF and ePub downloads, according to the available data) and Abstracts Views on Vision4Press platform.
Data correspond to usage on the plateform after 2015. The current usage metrics is available 48-96 hours after online publication and is updated daily on week days.
Initial download of the metrics may take a while.