Fig. 4
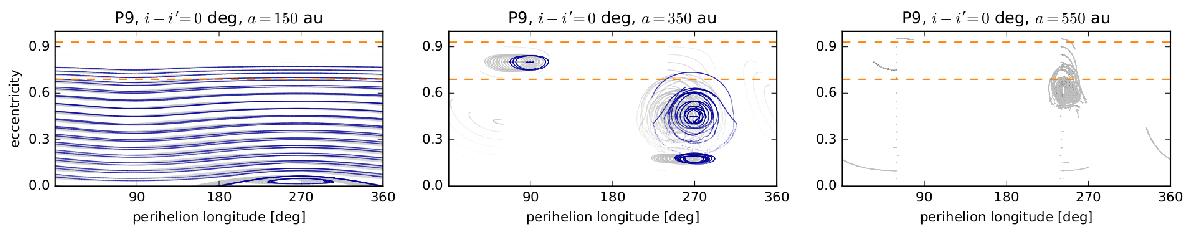
Evolution of test particles in L−e plane as inferred from the P9 simulation. The particles and P9 orbit the Sun in the same plane by design. The eccentricity range of the observed ETNOs is indicated by the dashed horizontal lines. Two transparency levels are used as a proxy for two different time windows of the simulation. The less transparent evolutionary tracks represent long-living particles in the last Gyr of the simulation. The more transparent tracks refer to evolution in the first 3 Gyr of the simulation and also comprise unstable orbits. Three starting semimajor axes were used as follows: a = 150 au (first column), a = 350 au (second column), and a = 550 au (third column). N-body encounters are completely omitted in this case, hence semimajor axes do not change during the simulation. The secular effect of the giant planets is modelled with a strong J2 moment of the Sun. There were no stable orbits at a = 550 au level.
Current usage metrics show cumulative count of Article Views (full-text article views including HTML views, PDF and ePub downloads, according to the available data) and Abstracts Views on Vision4Press platform.
Data correspond to usage on the plateform after 2015. The current usage metrics is available 48-96 hours after online publication and is updated daily on week days.
Initial download of the metrics may take a while.