Fig. 2
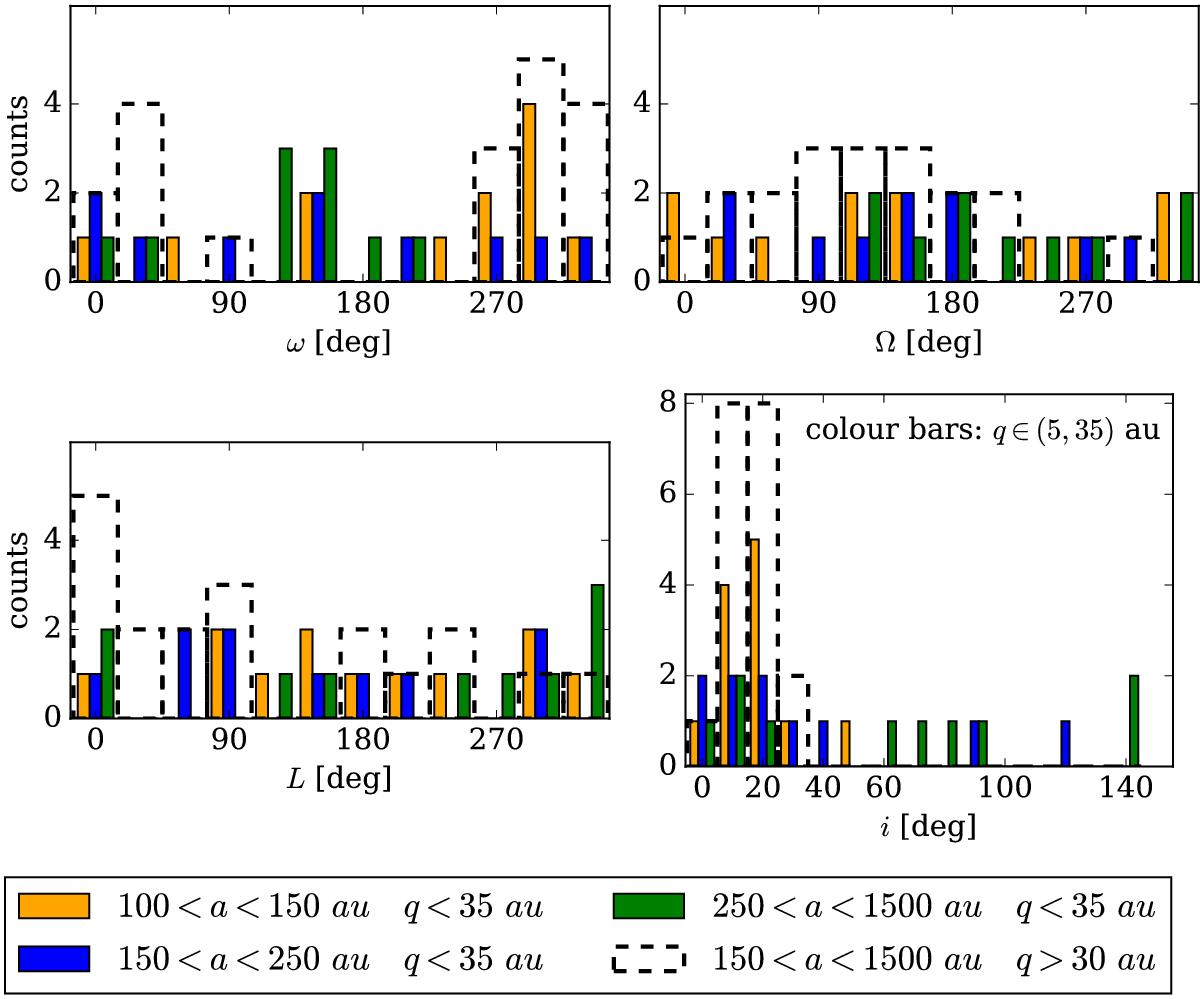
Histogram distributions of argument of perihelion (top left panel), longitude of ascending node (top right panel), perihelion longitude (bottom left panel), and inclination (bottom right panel) inferred from the well-determined orbits of TNOS and Centaurs fulfilling the criteria 100 <a< 1500 au, q< 35 au (colour histograms). The distributions inferred from all well-determined orbits of ETNOs (150 <a< 1500 au, q> 30 au) are indicated as dashed bars.
Current usage metrics show cumulative count of Article Views (full-text article views including HTML views, PDF and ePub downloads, according to the available data) and Abstracts Views on Vision4Press platform.
Data correspond to usage on the plateform after 2015. The current usage metrics is available 48-96 hours after online publication and is updated daily on week days.
Initial download of the metrics may take a while.