Fig. 15
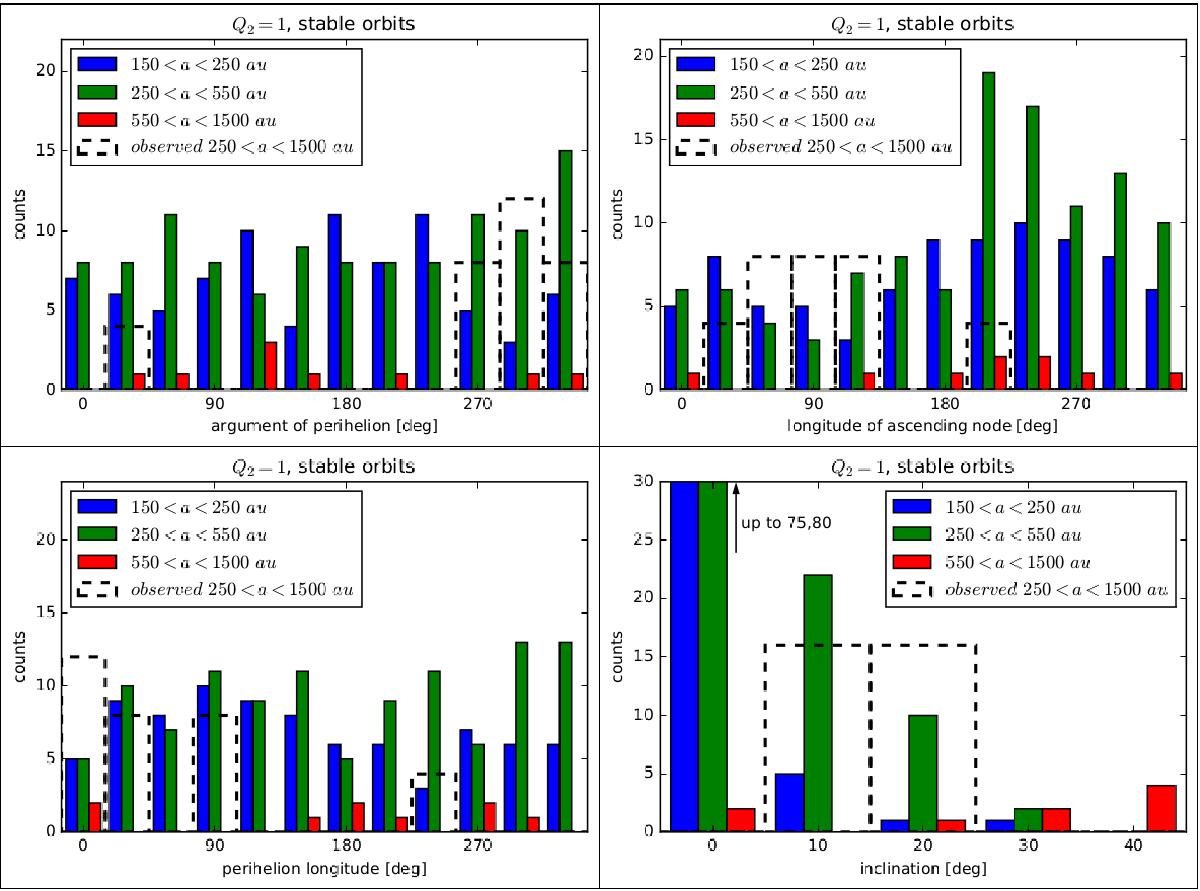
Histogram distributions of ω (top left panel), Ω (top right panel), L (bottom left panel), and i (bottom right panel) of test particle orbits at the end of the benchmark model simulation, i.e. at t = 4 Gyr. The strength of EFE was assumed to be Q2 = 1. Orbits are discerned according to their semimajor axis and divided into three groups: 150 <a< 250 au (blue histograms), 250 <a< 550 au (green histograms), and 550 <a< 1500 au (red histograms). The observed distributions for ETNOs with 250 <a< 1500 au, multiplied by factor 4, are shown as well (dashed histograms). Histograms are aligned to the left.
Current usage metrics show cumulative count of Article Views (full-text article views including HTML views, PDF and ePub downloads, according to the available data) and Abstracts Views on Vision4Press platform.
Data correspond to usage on the plateform after 2015. The current usage metrics is available 48-96 hours after online publication and is updated daily on week days.
Initial download of the metrics may take a while.