Fig. 13
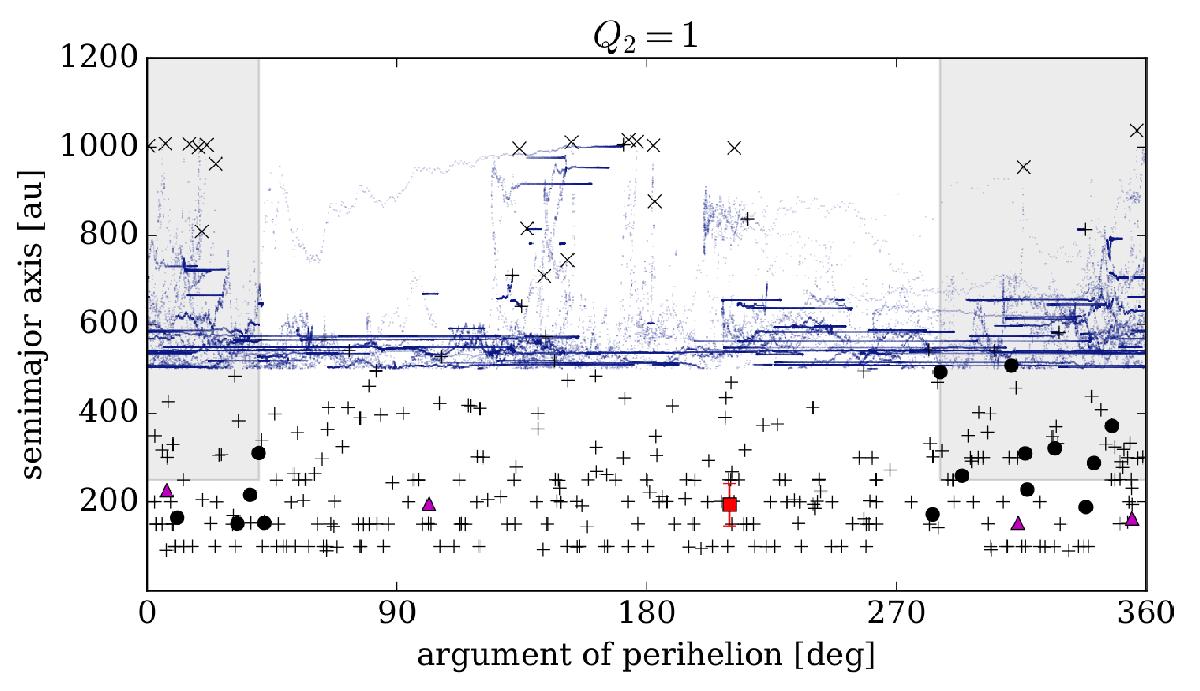
Evolution of test particle orbits, taken from the benchmark model simulation, in ω−a plane. The strength of EFE was assumed to be Q2 = 1. Only particles surviving at least 3 Gyr are taken into account. The evolutionary tracks of the particles are shown in the last Gyr of the simulation every time their orbits met the criteria, i.e. i< 50 deg, q< 80 au. The tracks below a = 500 au are not shown as these are just full-width horizontal lines.
Current usage metrics show cumulative count of Article Views (full-text article views including HTML views, PDF and ePub downloads, according to the available data) and Abstracts Views on Vision4Press platform.
Data correspond to usage on the plateform after 2015. The current usage metrics is available 48-96 hours after online publication and is updated daily on week days.
Initial download of the metrics may take a while.