Fig. 11
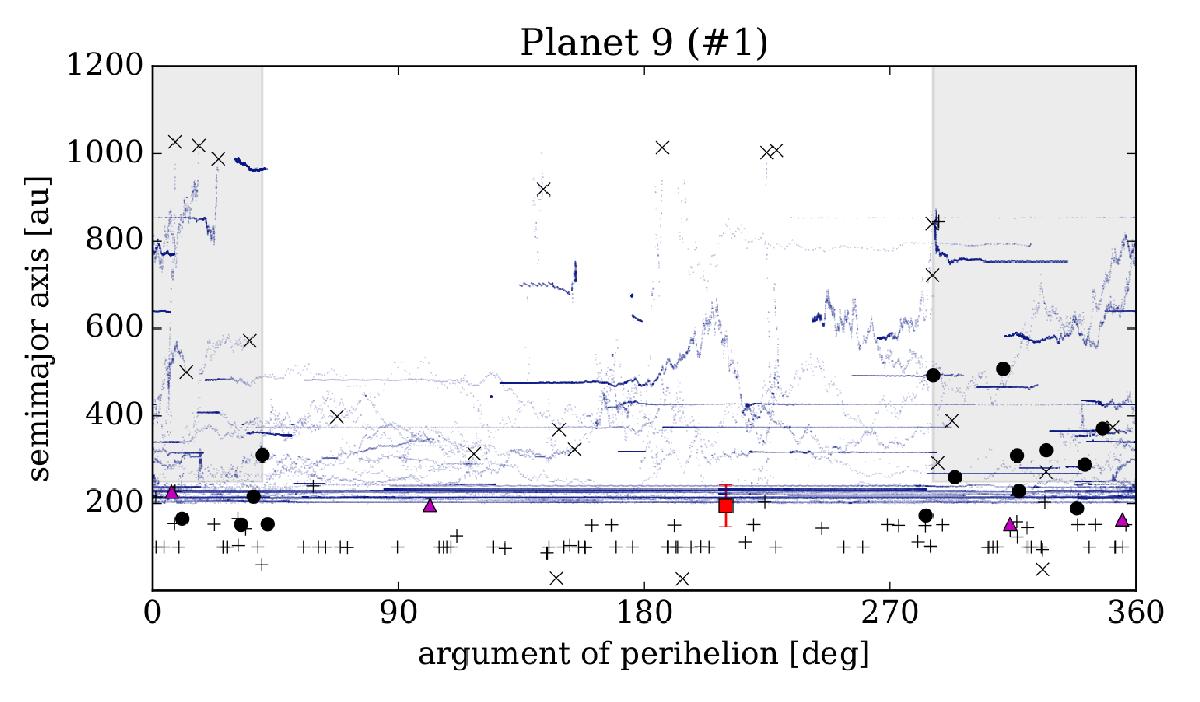
Evolution of test particle orbits, taken from the P9 simulation, in ω−a plane. Only particles surviving at least 3 Gyr are taken into account. The evolutionary tracks of the particles are shown in the last Gyr of the simulation every time their orbits met the criteria: i< 50 deg, q< 80 au. The tracks below a = 200 au are not shown as these are just a forest of full-width horizontal lines. The X symbols indicate the positions of potentially unstable particles, which are discarded at some time between t = 3 and 4 Gyr, at the time of their destruction. The plus signs indicate positions of long-living particles at t = 4 Gyr. The known ETNOs with q> 35 au (circles) and q< 35 au (triangles) are plotted. TNO 2003 SS422 is denoted as a square and its large uncertainty in a is indicated by the error bar. Shaded regions indicate the observed clustering regions for a> 250 au ETNOs.
Current usage metrics show cumulative count of Article Views (full-text article views including HTML views, PDF and ePub downloads, according to the available data) and Abstracts Views on Vision4Press platform.
Data correspond to usage on the plateform after 2015. The current usage metrics is available 48-96 hours after online publication and is updated daily on week days.
Initial download of the metrics may take a while.