Fig. 1
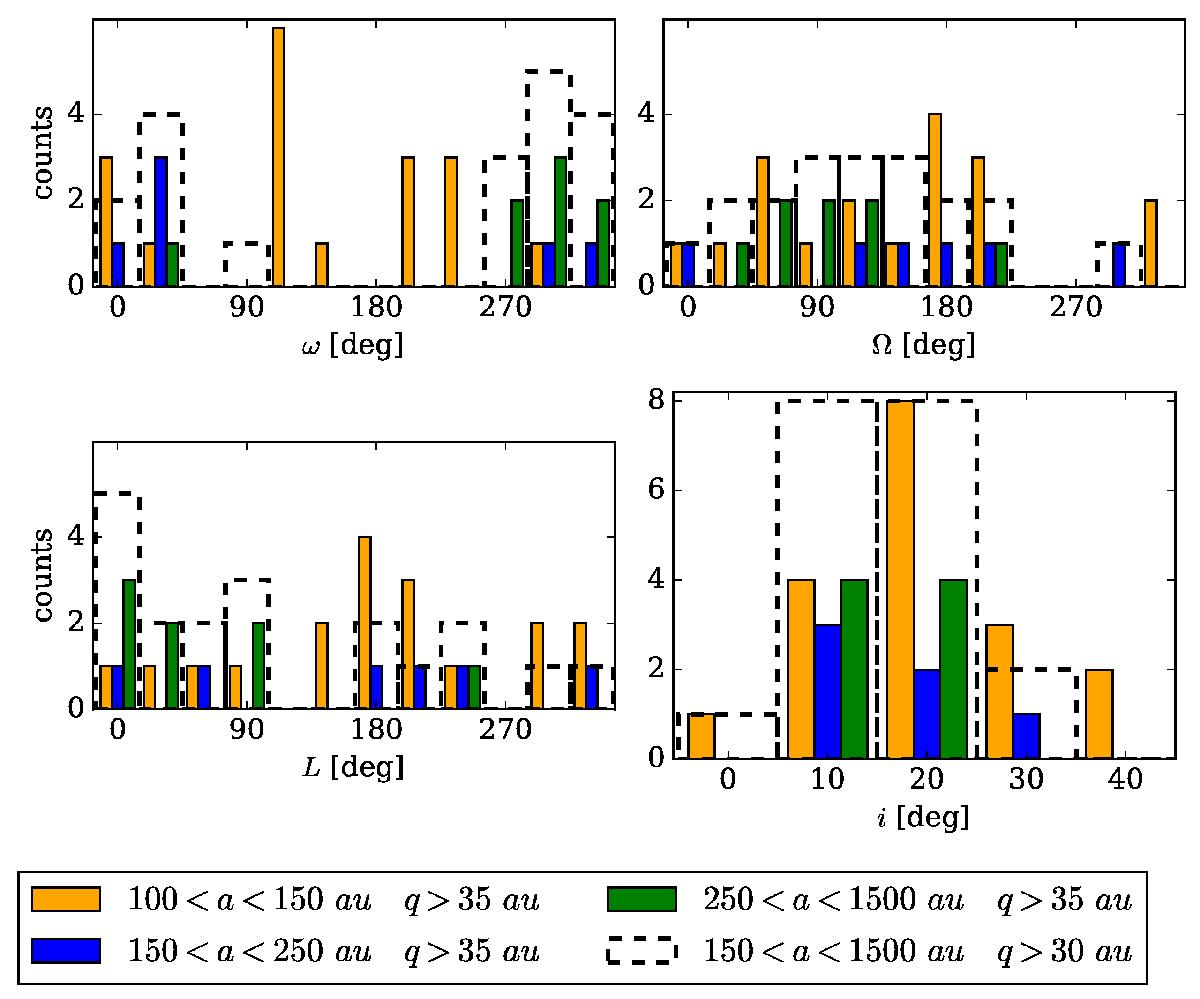
Histogram distributions of argument of perihelion (top left panel), longitude of ascending node (top right panel), perihelion longitude (bottom left panel), and inclination (bottom right panel) inferred from the well-determined orbits of TNOs fulfilling the criteria 100 <a< 1500 au, q> 35 au (colour histograms). The orbits were discerned according to their a and divided into 3 groups: 100 <a< 150 au (yellow histogram), 150 <a< 250 au (blue histogram), and 250 <a< 1500 au (green histogram). The distributions inferred from all well-determined orbits of ETNOs (150 <a< 1500 au, q> 30 au) are indicated as dashed bars. The blue and green bars in a given bin can, but do not have to, sum up to the height of a dashed bar in that bin, as the dashed bar also comprises objects with q in the range from 30 to 35 au. The histogram bars are aligned to the left, for example, in the bottom right panel, 0 indicates inclination range (0,10) deg, 10 indicates inclination range (10,20) deg, and so on.
Current usage metrics show cumulative count of Article Views (full-text article views including HTML views, PDF and ePub downloads, according to the available data) and Abstracts Views on Vision4Press platform.
Data correspond to usage on the plateform after 2015. The current usage metrics is available 48-96 hours after online publication and is updated daily on week days.
Initial download of the metrics may take a while.