Fig. 5
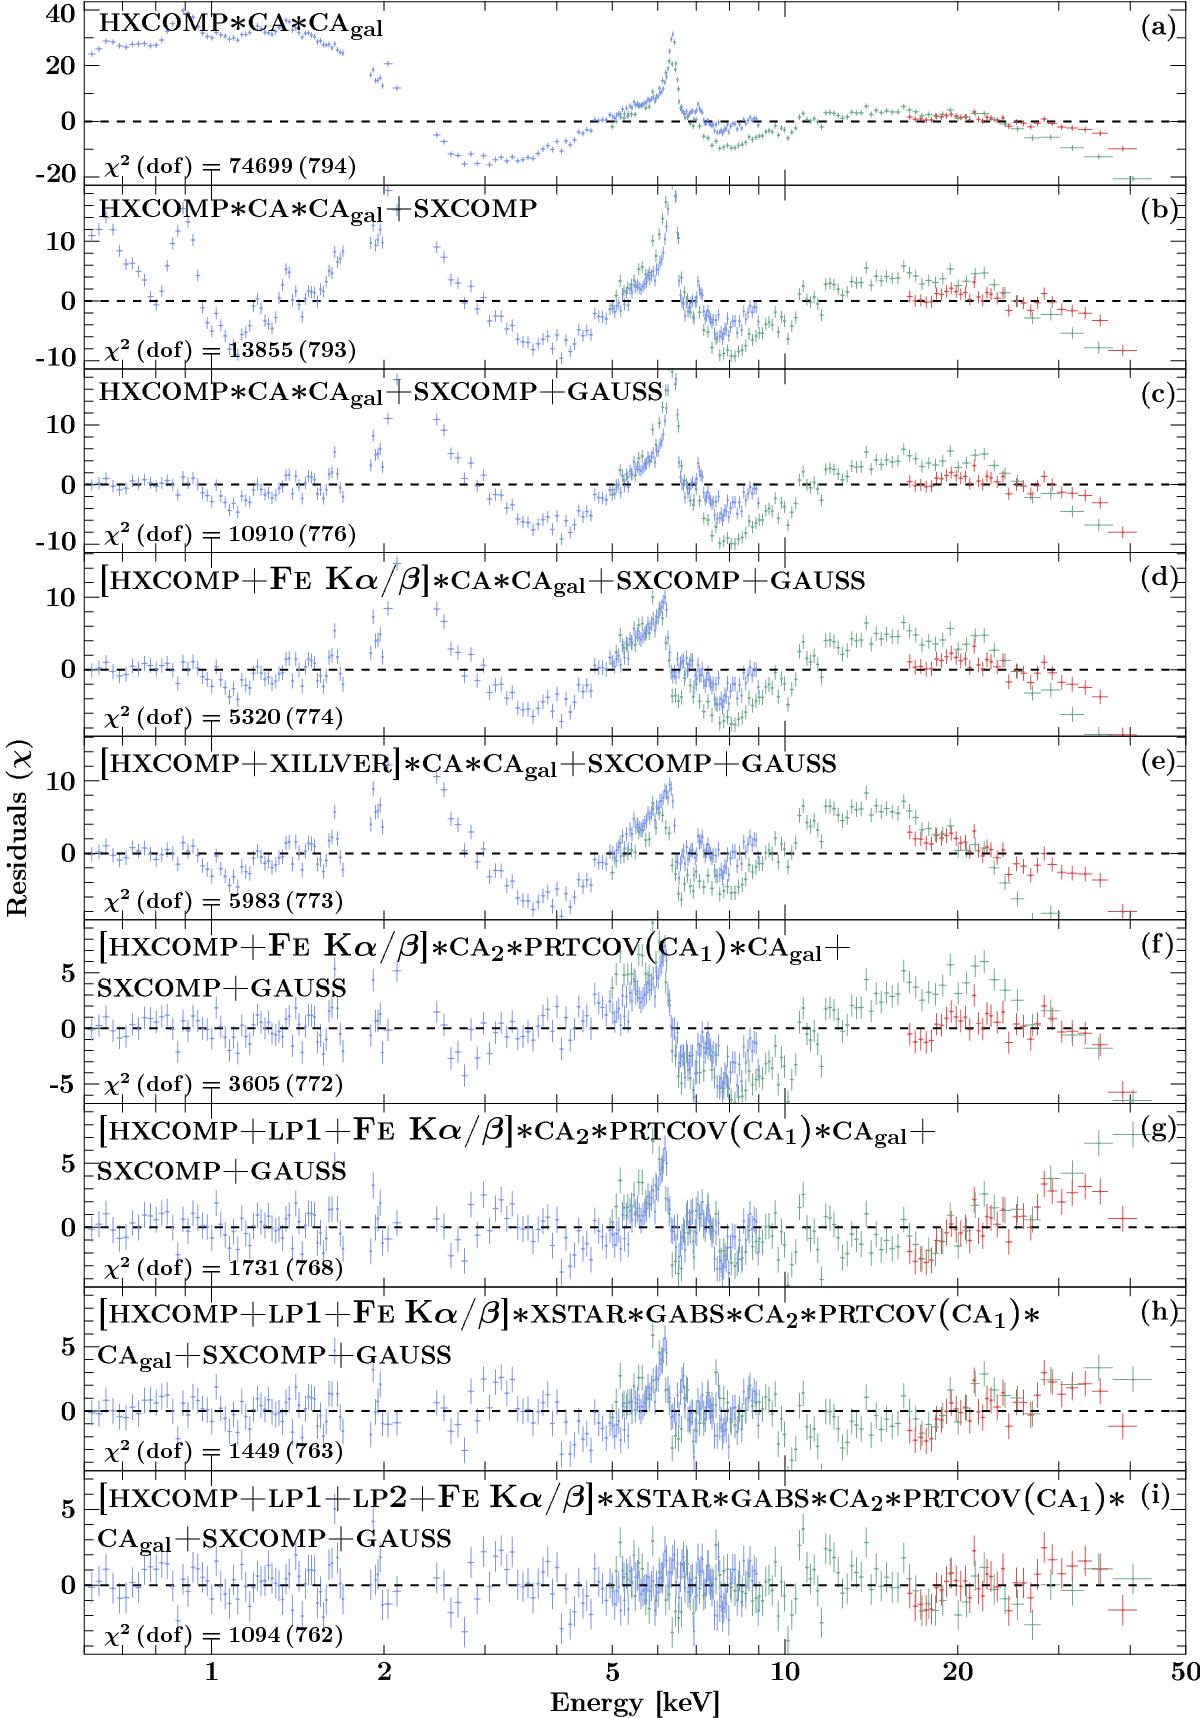
Residuals (χ) for a bottom-up approach towards the best-fit of Suz3. The statistics of each step are shown on the bottom left. NuSTAR residuals below 5 keV are excluded from the plot due to deviations of the cross-calibration between Suzaku and NuSTAR. The ranges of the residual axes are adapted in order to show the full dynamic range.
Current usage metrics show cumulative count of Article Views (full-text article views including HTML views, PDF and ePub downloads, according to the available data) and Abstracts Views on Vision4Press platform.
Data correspond to usage on the plateform after 2015. The current usage metrics is available 48-96 hours after online publication and is updated daily on week days.
Initial download of the metrics may take a while.