Fig. 15
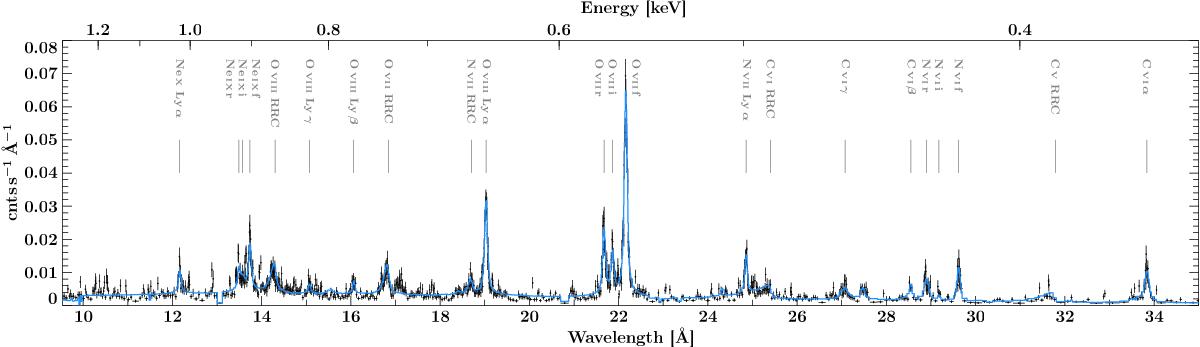
Combined count spectrum including all XMM-Newton/RGS observations, each with two diffraction orders for each of the two RGS detectors RGS1 and RGS2. For reasons of visibility, the data are binned to a minimal S/N of 3. The model consists of the underlying SXCOMP continuum complemented with a set of emission lines in blue. Line identifiers are shown on top of the individual lines.
Current usage metrics show cumulative count of Article Views (full-text article views including HTML views, PDF and ePub downloads, according to the available data) and Abstracts Views on Vision4Press platform.
Data correspond to usage on the plateform after 2015. The current usage metrics is available 48-96 hours after online publication and is updated daily on week days.
Initial download of the metrics may take a while.