Free Access
Fig. 10
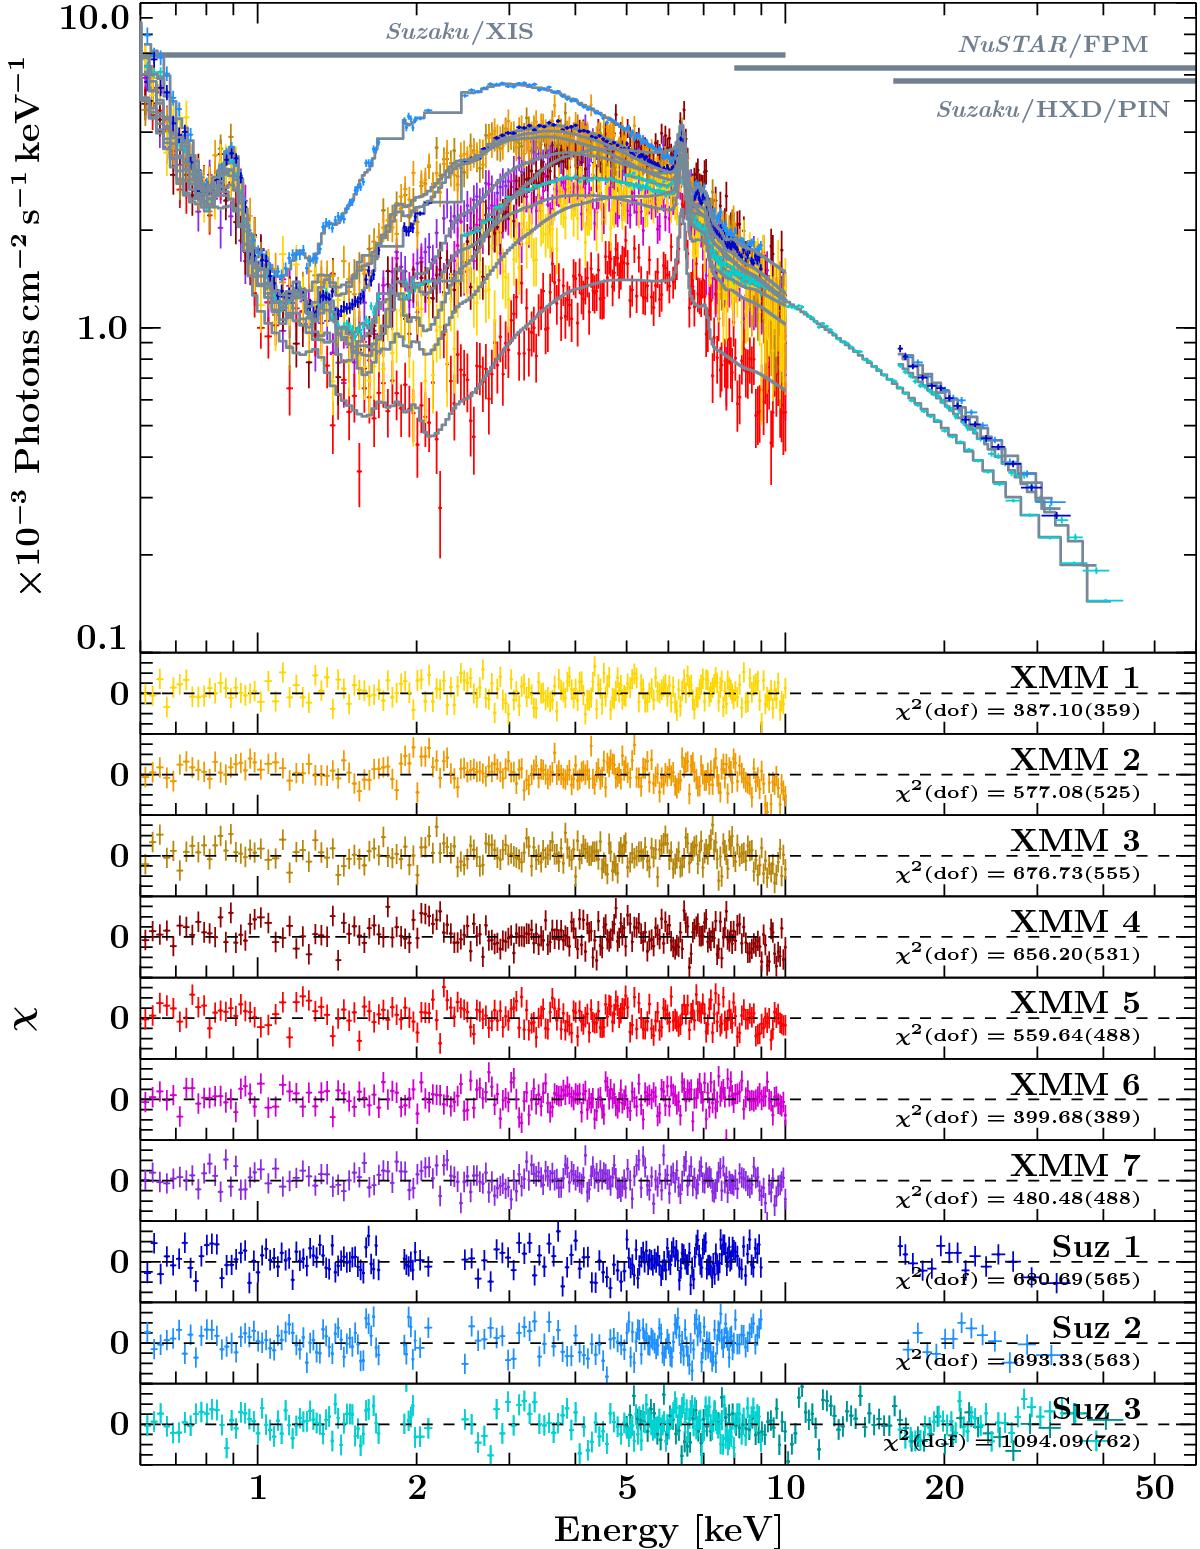
Composite of all XMM-Newton and Suzaku spectra as well as one NuSTAR spectrum simultaneous to Suz 3 with the applied best-fit baseline model and residuals. The statistics of each fit are listed in the residual panels. The minor ticmarks in the residual panels are separated by 0.1.
Current usage metrics show cumulative count of Article Views (full-text article views including HTML views, PDF and ePub downloads, according to the available data) and Abstracts Views on Vision4Press platform.
Data correspond to usage on the plateform after 2015. The current usage metrics is available 48-96 hours after online publication and is updated daily on week days.
Initial download of the metrics may take a while.