Fig. 1
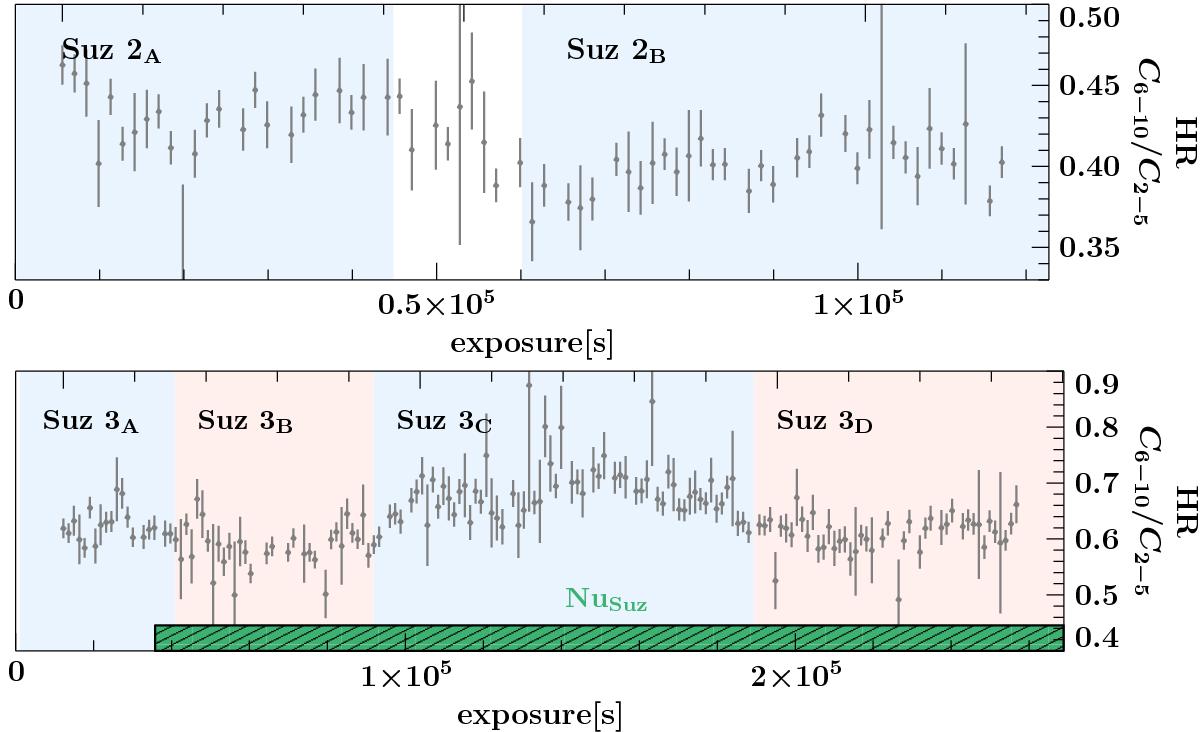
Hardness ratio of the 55 ks and 150 ks Suzaku observations Suz 2 (top) and Suz 3 (bottom) given by the ratio of count-rate light curves extracted between 6–10 keV and 2–5 keV. The shaded regions divide the observation in different parts for a time-resolved spectroscopy and are derived using a Bayesian block analysis. The green-shaded and striped region in the bottom panel indicates the relative observation time of NuSuz.
Current usage metrics show cumulative count of Article Views (full-text article views including HTML views, PDF and ePub downloads, according to the available data) and Abstracts Views on Vision4Press platform.
Data correspond to usage on the plateform after 2015. The current usage metrics is available 48-96 hours after online publication and is updated daily on week days.
Initial download of the metrics may take a while.