Free Access
Fig. 5
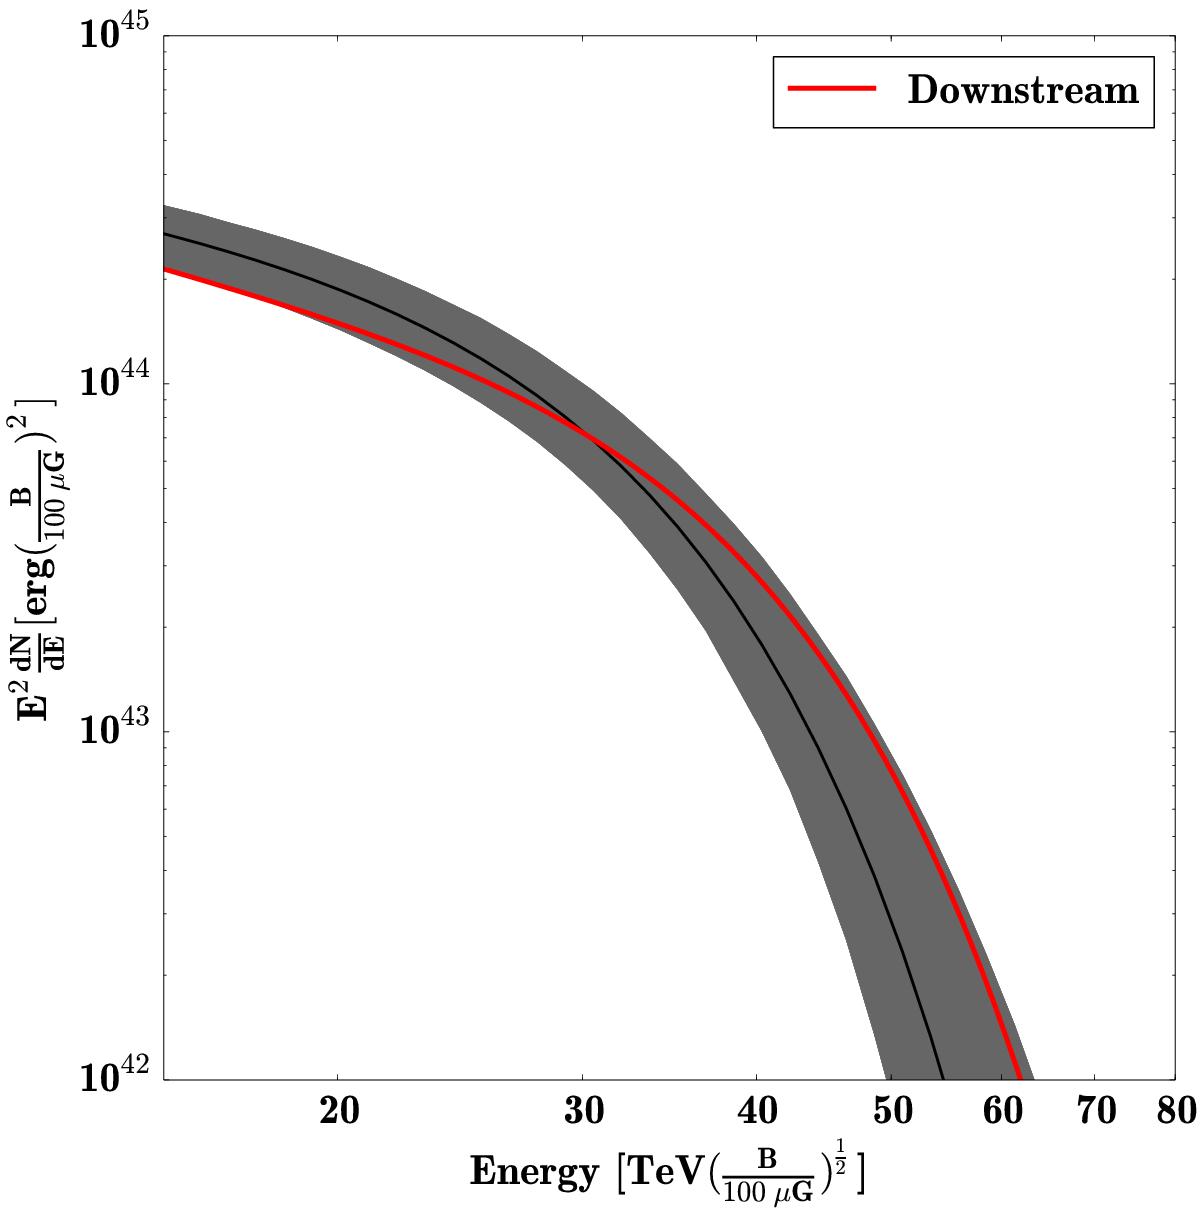
Electron spectrum from the X-ray data points (black curve and shaded area) and theoreticallly predicted integrated electron spectrum in a young SNR (red curve) assuming a fast diffusion with η = 20. Also shown is the contribution from the downstream region.
Current usage metrics show cumulative count of Article Views (full-text article views including HTML views, PDF and ePub downloads, according to the available data) and Abstracts Views on Vision4Press platform.
Data correspond to usage on the plateform after 2015. The current usage metrics is available 48-96 hours after online publication and is updated daily on week days.
Initial download of the metrics may take a while.