Free Access
Fig. 9
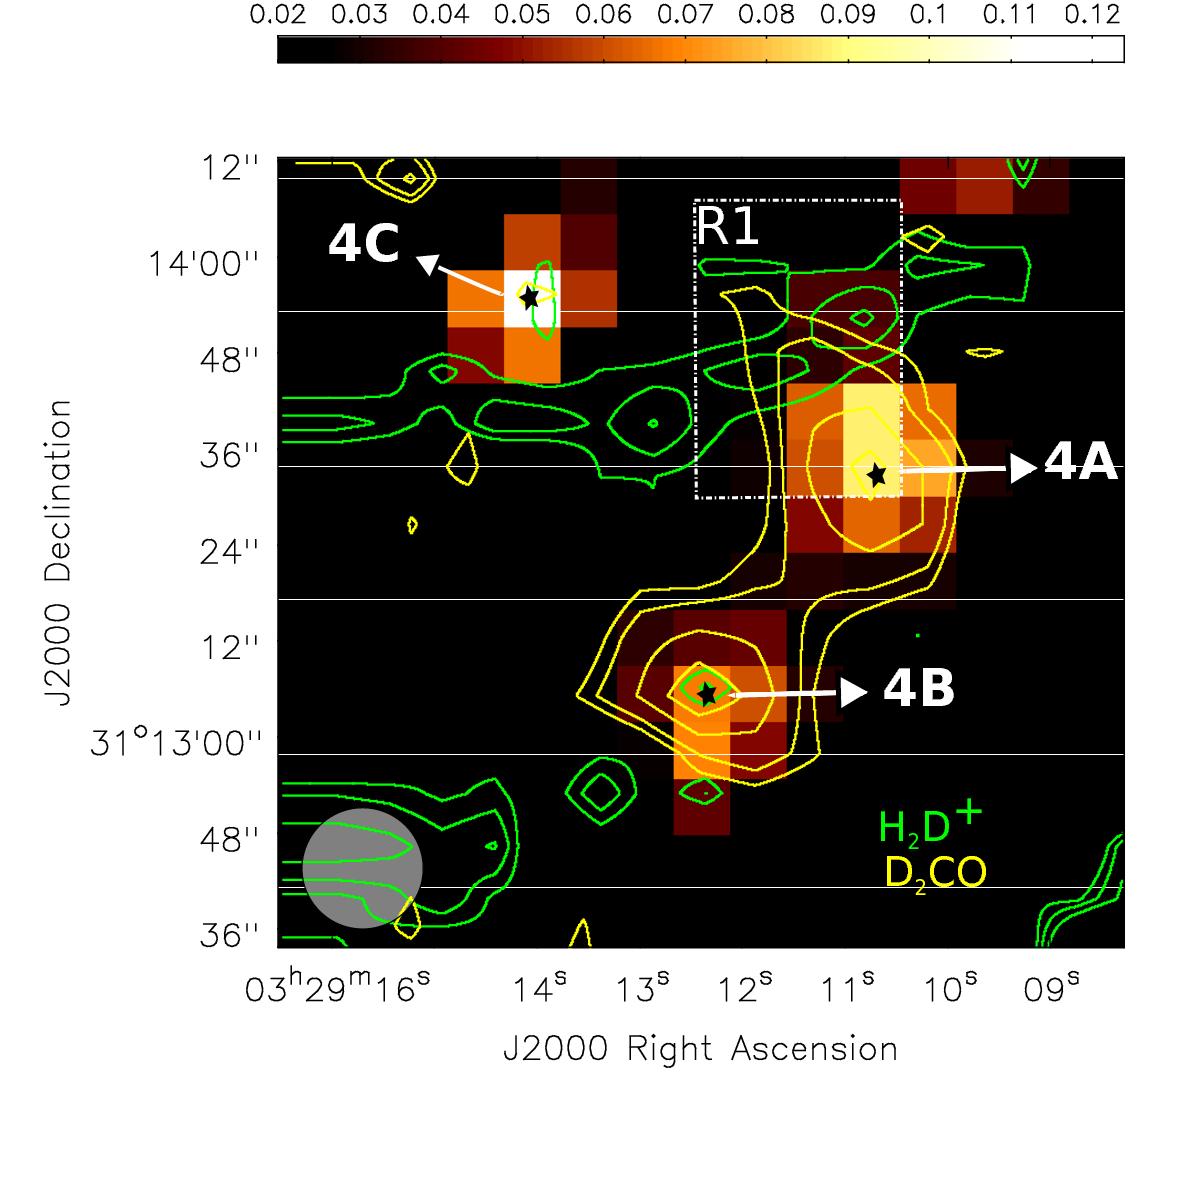
The spatial distribution of deuterated species in IRAS 4 region. Integrated intensity map (core; from +5 to +9 km s-1) of C2H which traces the envelope in colors, overplotted with H2D+ in green contours and D2CO in yellow contours. The contour levels are set to 0.014, 0.016, 0.023 and 0.03 K (rms ~ 0.005 K).
Current usage metrics show cumulative count of Article Views (full-text article views including HTML views, PDF and ePub downloads, according to the available data) and Abstracts Views on Vision4Press platform.
Data correspond to usage on the plateform after 2015. The current usage metrics is available 48-96 hours after online publication and is updated daily on week days.
Initial download of the metrics may take a while.