Fig. 4
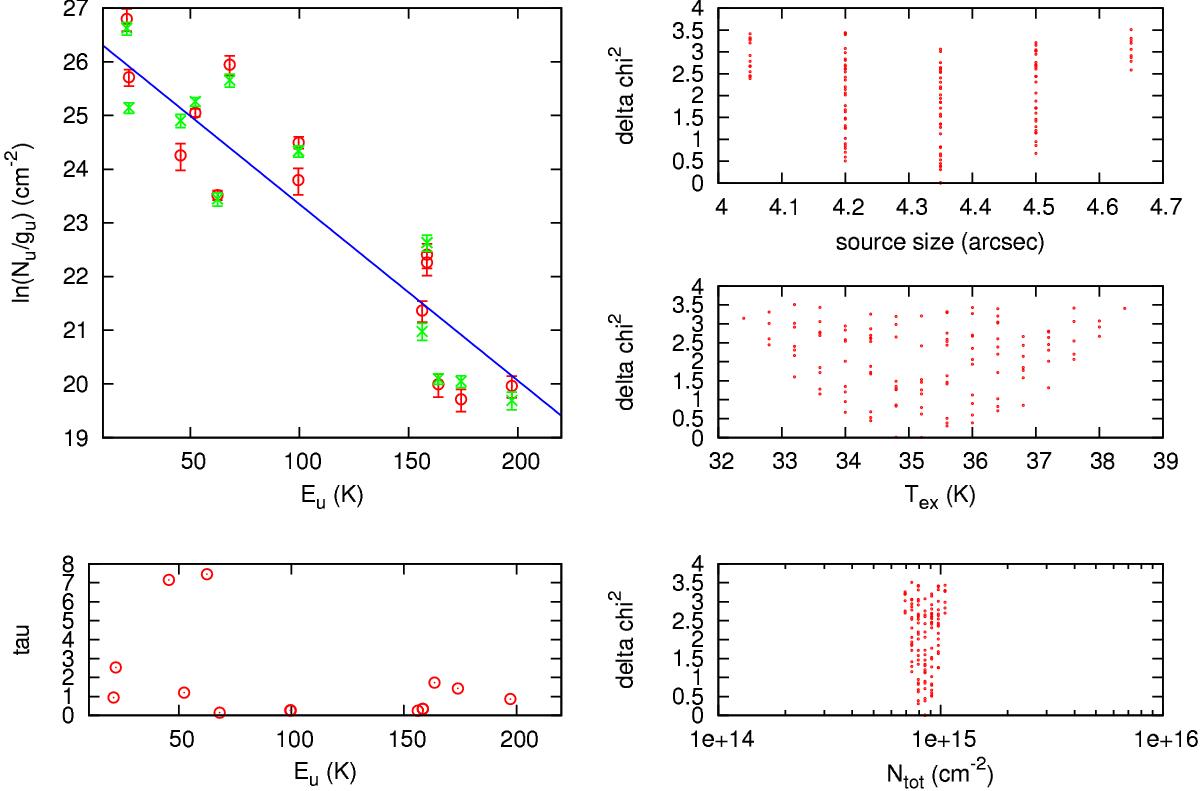
Results of population diagram based on the narrow component (envelope) of H2CO as observed with JCMT and HIFI (150 K < Eup < 200 K) and the additional IRAM transitions as taken by Maret et al. (2004). The plot presents the resulting excitation temperature (Tex ~ Trot), column density (Ntot), optical depth (tau) and size of the emitting area. The red symbols represent the observed data, the green symbols represent the best fitted data, and the blue line represents the rotation diagram fit. The three right panels show the resulting values after using the χ2 method to converge to the solution.
Current usage metrics show cumulative count of Article Views (full-text article views including HTML views, PDF and ePub downloads, according to the available data) and Abstracts Views on Vision4Press platform.
Data correspond to usage on the plateform after 2015. The current usage metrics is available 48-96 hours after online publication and is updated daily on week days.
Initial download of the metrics may take a while.