Free Access
Fig. 3
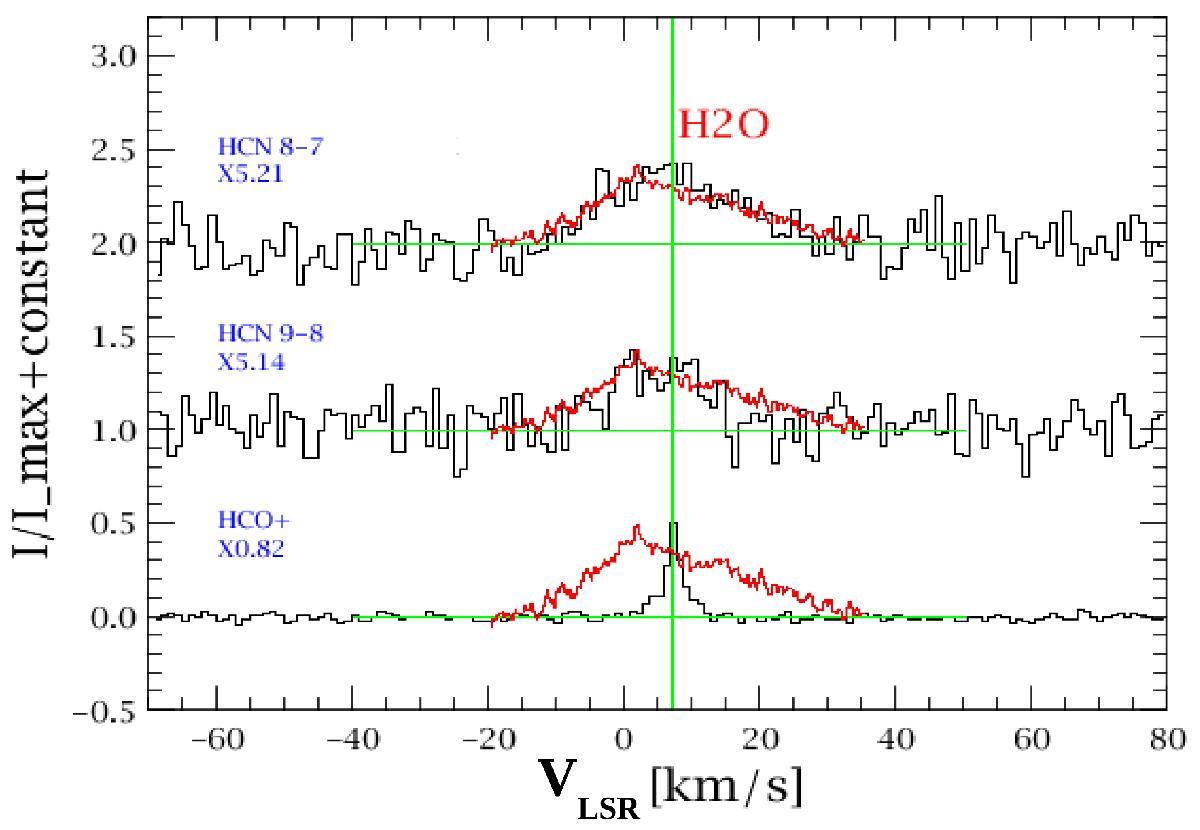
Normalized HCN and HCO+ line profiles (black) scaled by the indicated factors compared to the H2O 211–202 (red). The shape of the HCN line profile is comparable to the H2O but HCO+ is narrower. The vertical green line represents the central velocity of the source at 6.7 km s-1.
Current usage metrics show cumulative count of Article Views (full-text article views including HTML views, PDF and ePub downloads, according to the available data) and Abstracts Views on Vision4Press platform.
Data correspond to usage on the plateform after 2015. The current usage metrics is available 48-96 hours after online publication and is updated daily on week days.
Initial download of the metrics may take a while.