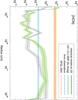
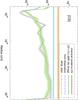
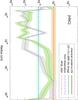
Fig. C.1
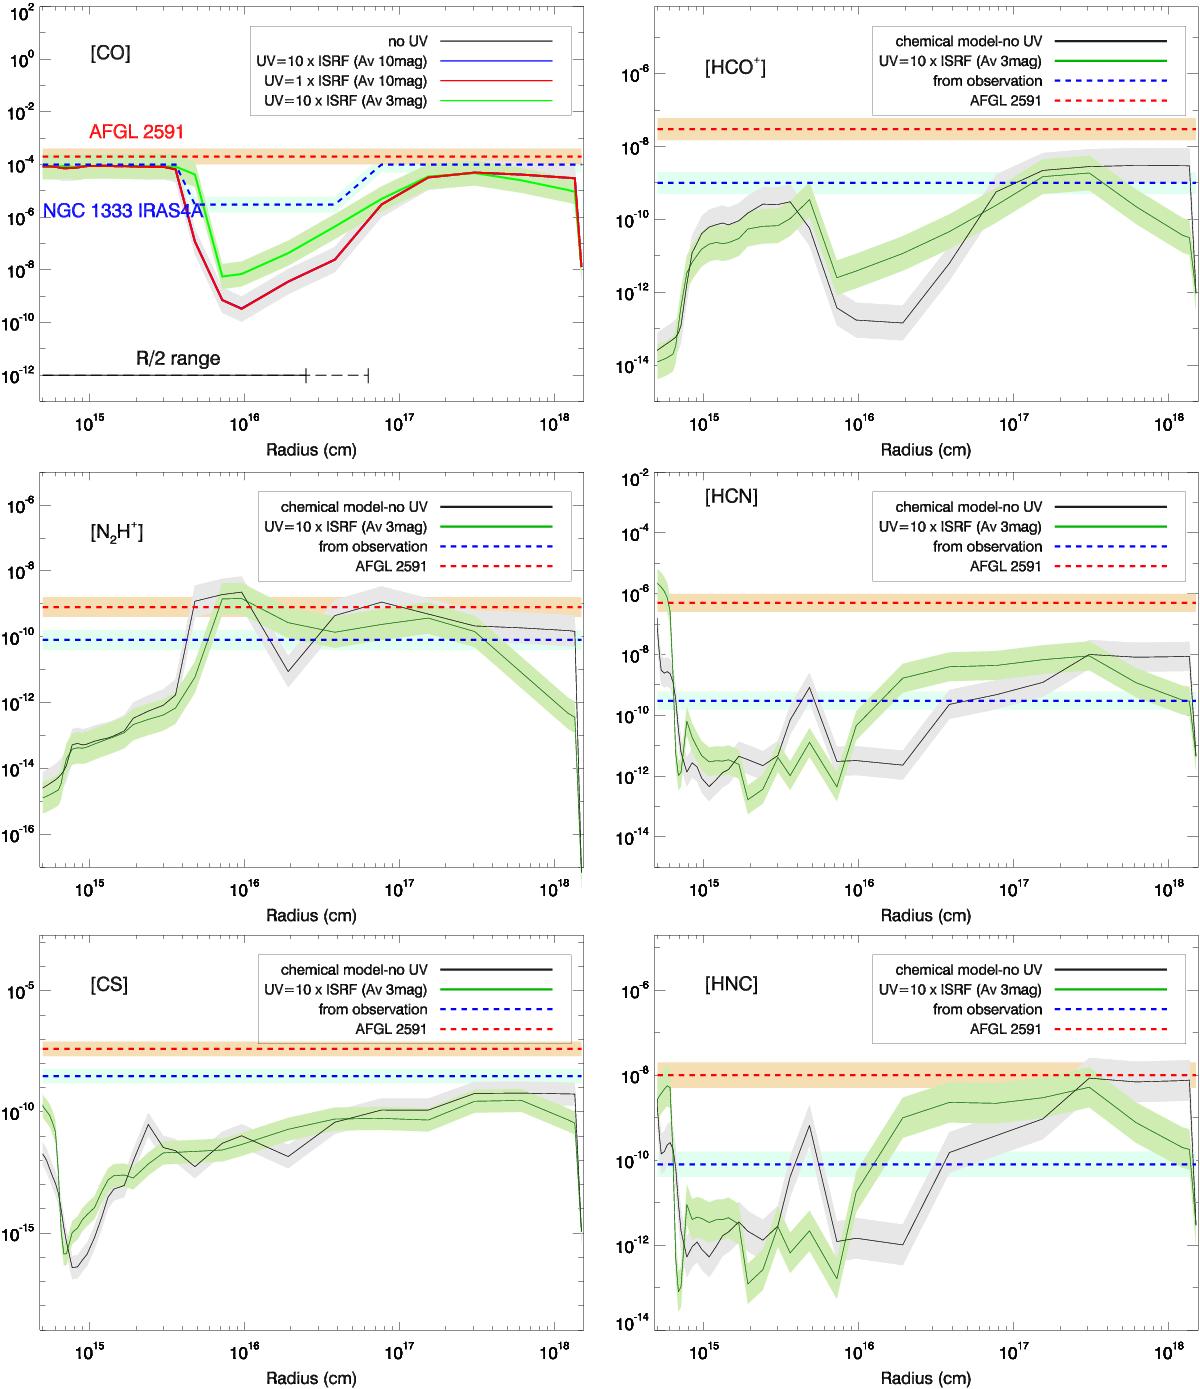
Observed and modeled abundance profiles of CO, HCO+, N2H+, CS, HCN and HNC at the minimum representative timescale of 4 × 10⁴ yr as predicted from the time-dependent CH3OH models. The red dashed lines show the abundance profile of the outer envelope of the high-mass case, AFGL 2591 (Kaźmierczak-Barthel et al. 2015) for comparison with NGC 1333 IRAS 4A (blue). The black solid lines represent the abundance profiles from the 1D chemical model. The green solid lines represent the abundance profiles from the 1D chemical model that aims to take into account outflow cavities by applying an extra UV radiation of 10 × ISRF at AV = 3 mag. The angular resolution of the observations varies between ~15″ and ~35″, which corresponds to 2.5–6.3 × 1016 cm (1670–4210 au) in the models.
Current usage metrics show cumulative count of Article Views (full-text article views including HTML views, PDF and ePub downloads, according to the available data) and Abstracts Views on Vision4Press platform.
Data correspond to usage on the plateform after 2015. The current usage metrics is available 48-96 hours after online publication and is updated daily on week days.
Initial download of the metrics may take a while.