Free Access
Fig. 15
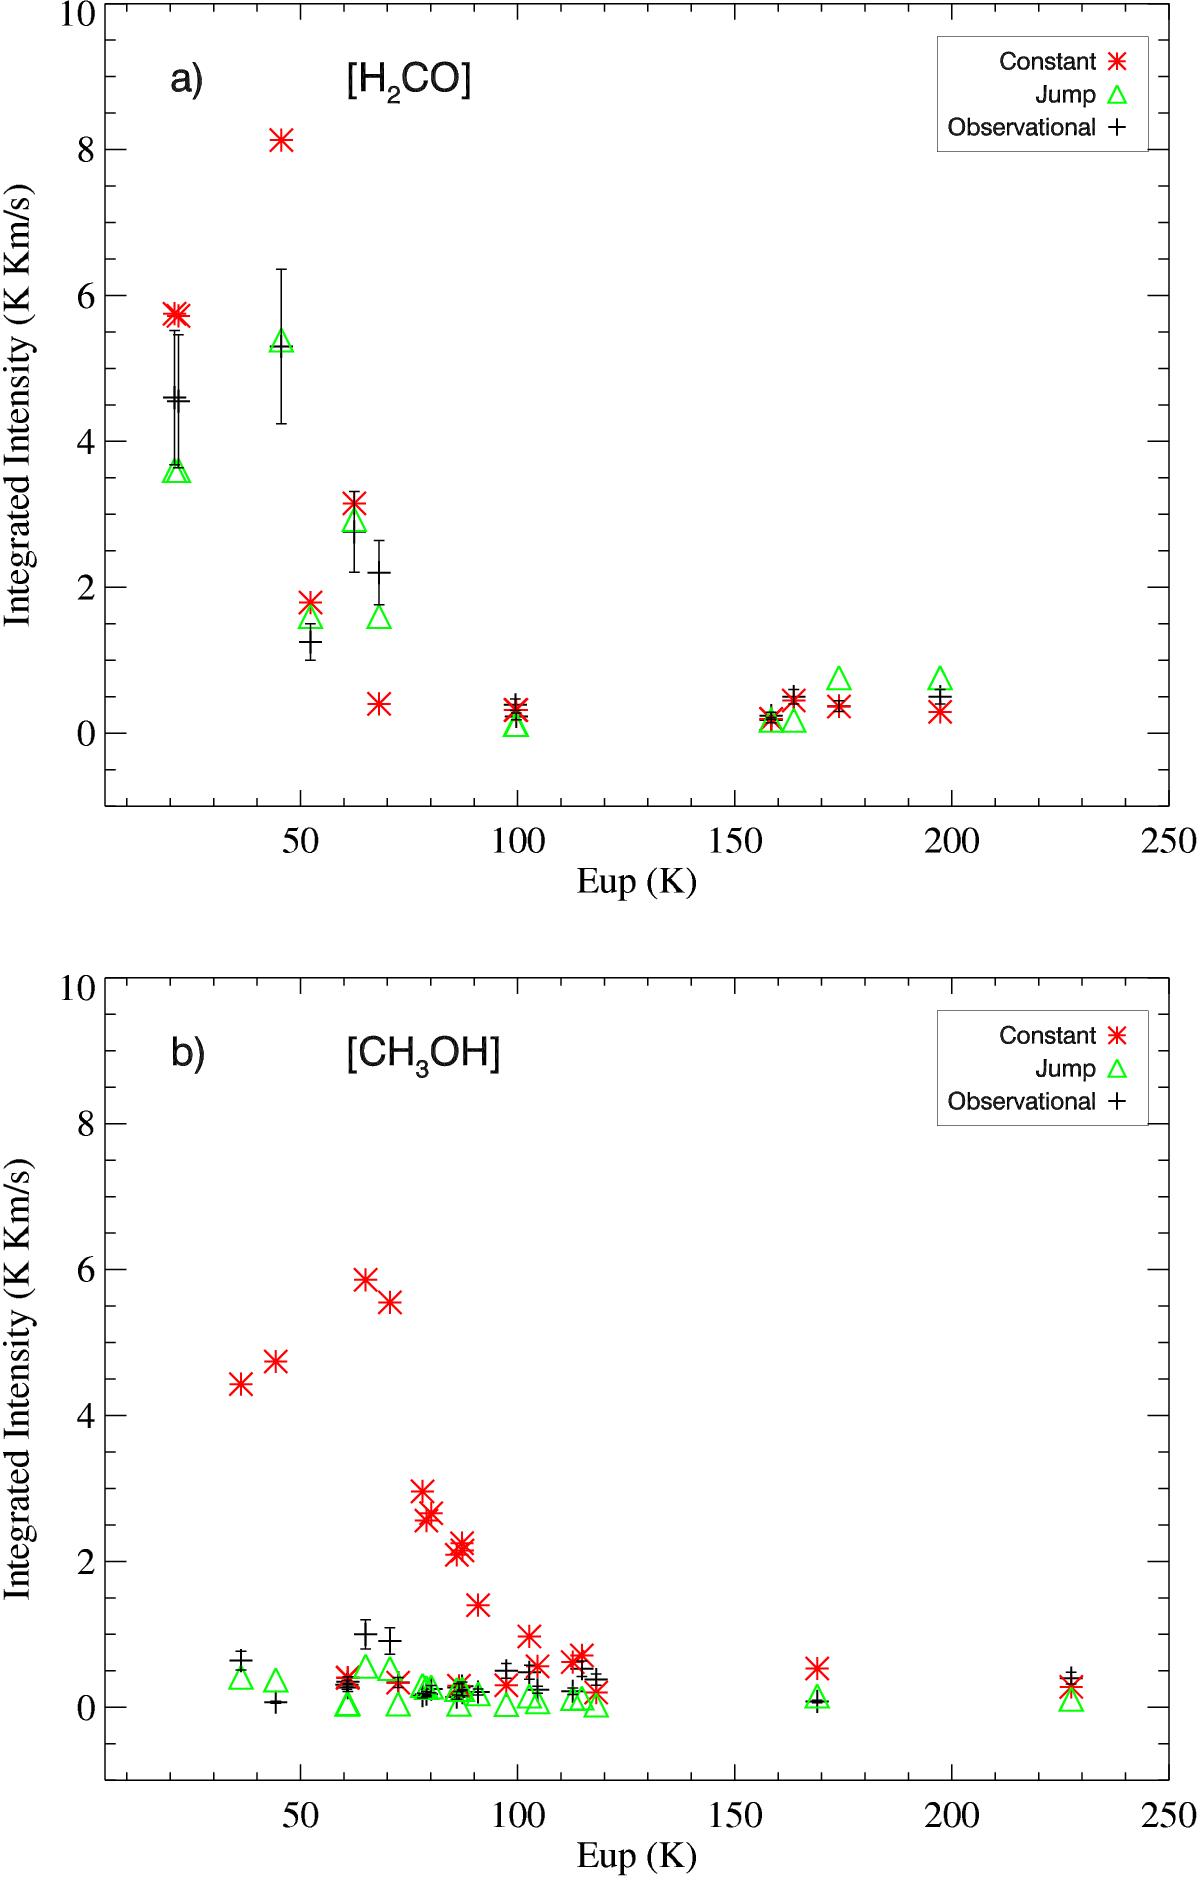
Integrated intensities of the observed (black) and modeled a) H2CO and b) CH3OH transitions in the observed Eup range using a constant abundance of [H2CO] = 4 × 10⁻¹⁰ and [CH3OH] = 1 × 10⁻⁸ (red) and a jump model (green). The errors of the observed values are ~20% of the measured value.
This figure is made of several images, please see below:
Current usage metrics show cumulative count of Article Views (full-text article views including HTML views, PDF and ePub downloads, according to the available data) and Abstracts Views on Vision4Press platform.
Data correspond to usage on the plateform after 2015. The current usage metrics is available 48-96 hours after online publication and is updated daily on week days.
Initial download of the metrics may take a while.