Fig. 14
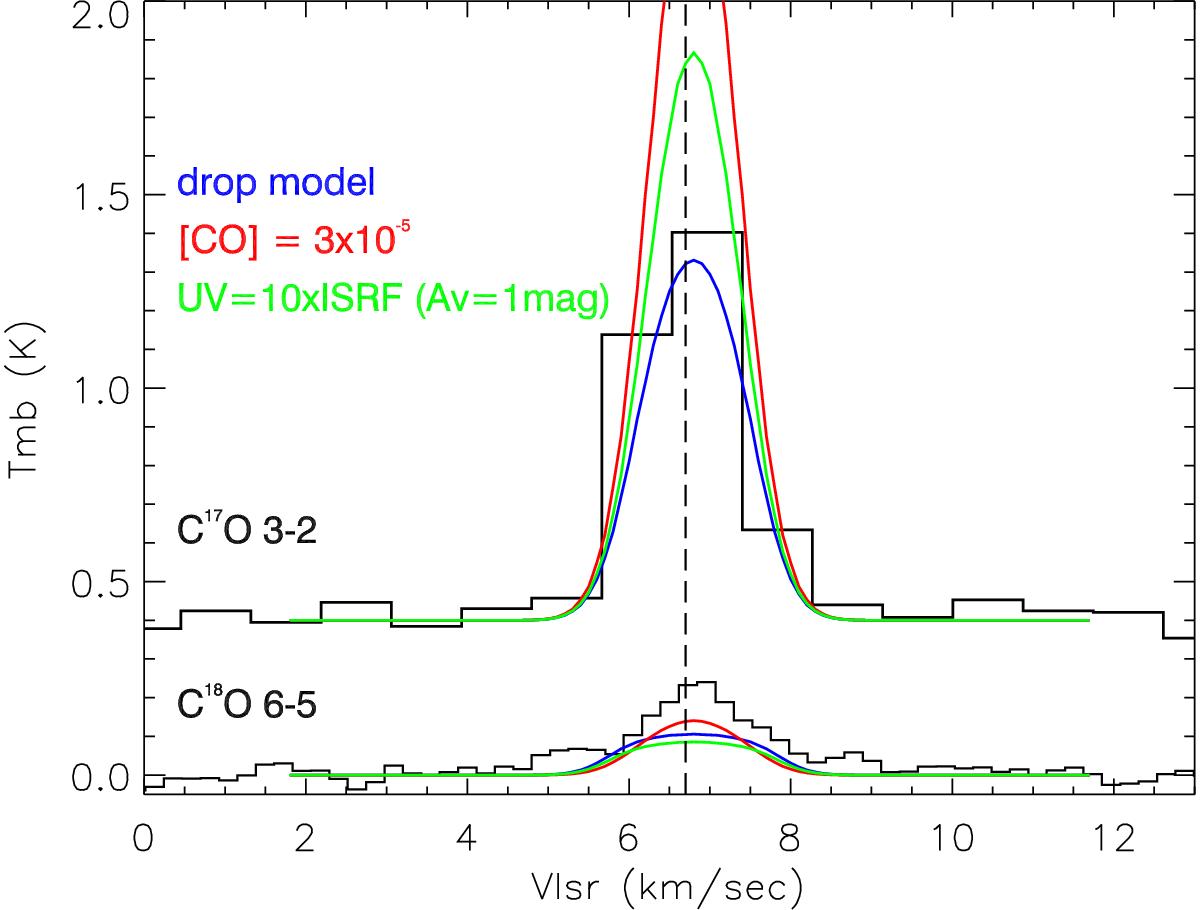
Observed C17O 3–2 and C18O 6–5 line profiles (black) overplotted with the modeled line profiles resulting in RATRAN after applying a) ~1.5 orders of magnitude drop in CO abundance at the snowline (blue) or b) CO constant abundance of 3 × 10⁻⁵ (red) and the best-fit abundance profile as derived from our chemical models for UV = 10 × ISRF at AV = 1 mag (black line in Fig. C.4).
Current usage metrics show cumulative count of Article Views (full-text article views including HTML views, PDF and ePub downloads, according to the available data) and Abstracts Views on Vision4Press platform.
Data correspond to usage on the plateform after 2015. The current usage metrics is available 48-96 hours after online publication and is updated daily on week days.
Initial download of the metrics may take a while.