Free Access
Fig. 11
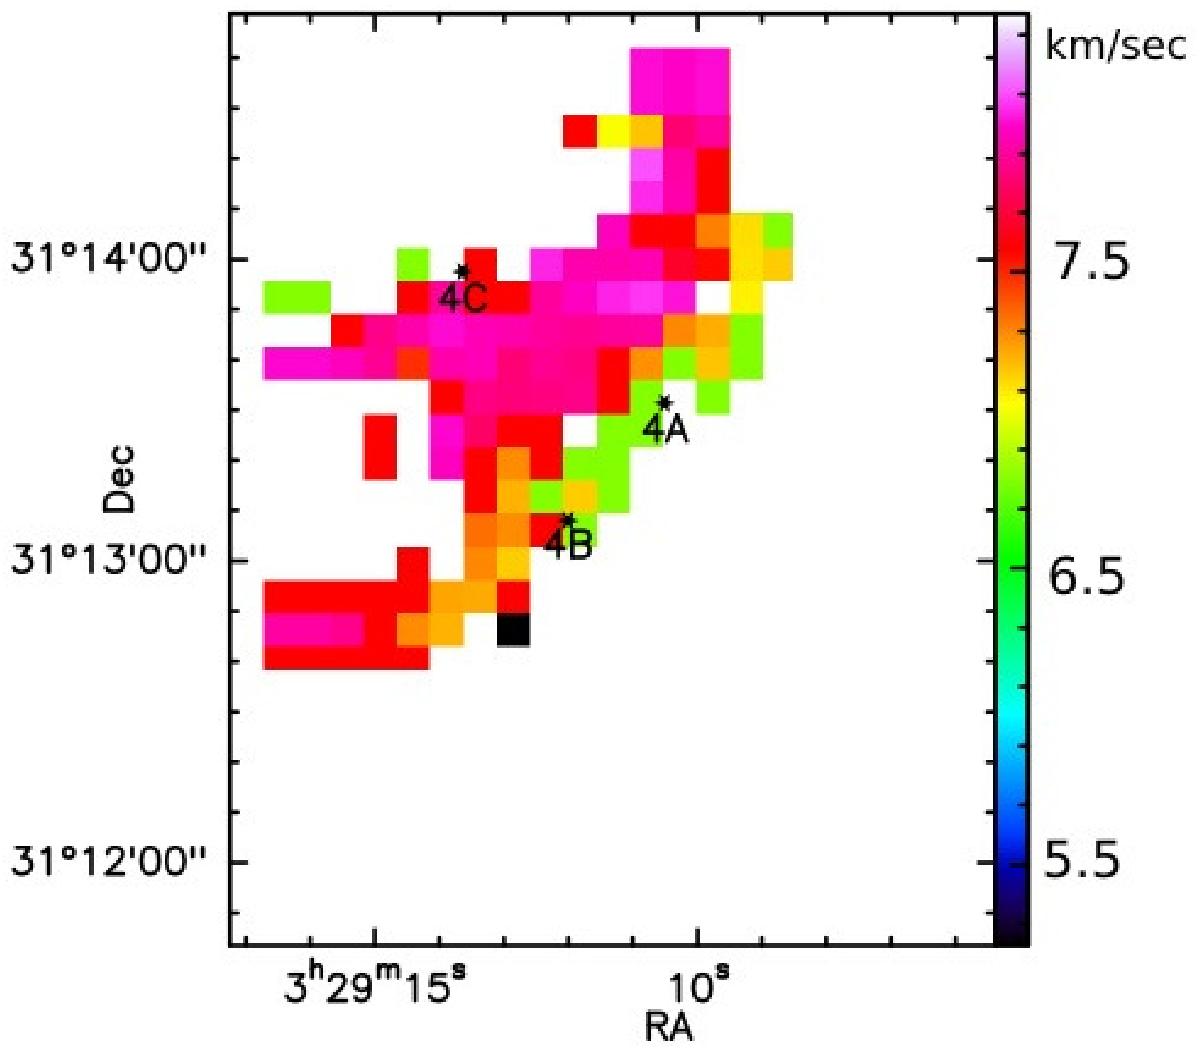
Central velocity map of H2D+. The main layer of H2D+ is characterized by velocities of ~8 km s-1. The emission in the S–E lobe is >3 RMS and it seems to be real.
Current usage metrics show cumulative count of Article Views (full-text article views including HTML views, PDF and ePub downloads, according to the available data) and Abstracts Views on Vision4Press platform.
Data correspond to usage on the plateform after 2015. The current usage metrics is available 48-96 hours after online publication and is updated daily on week days.
Initial download of the metrics may take a while.