Free Access
Fig. 6
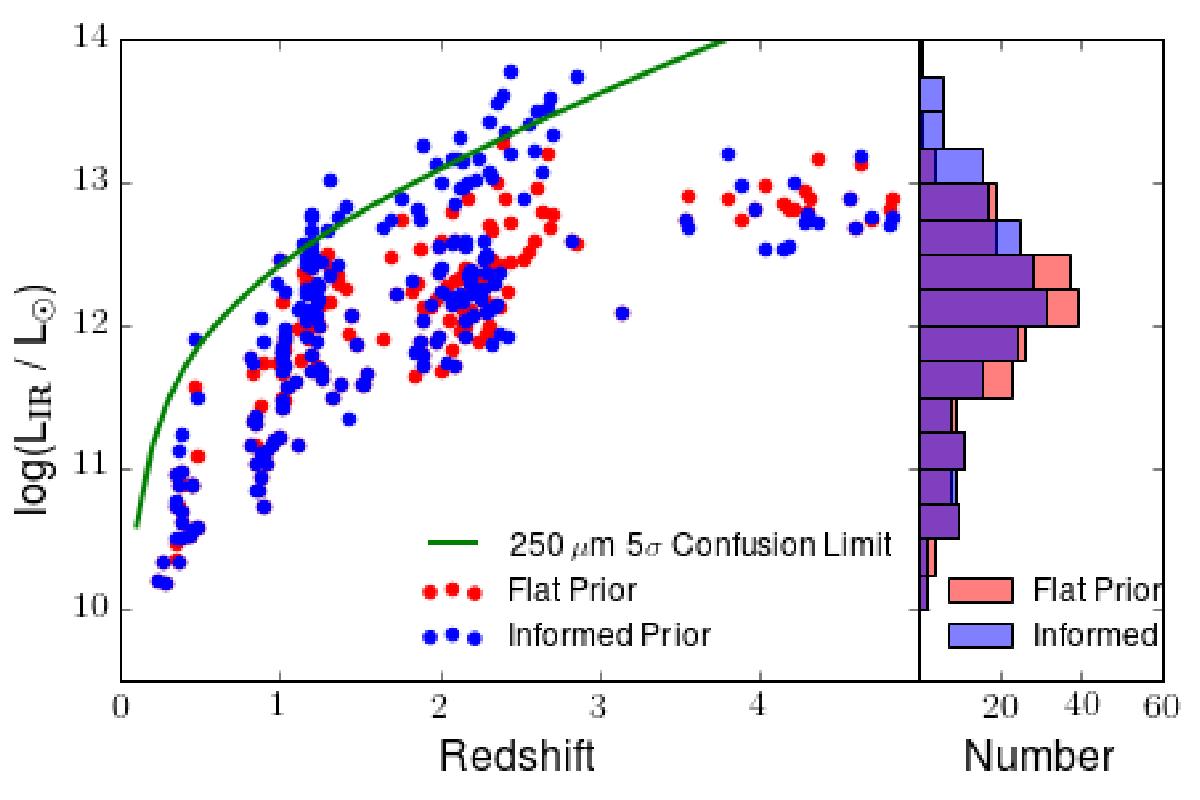
Scatter plot of the infrared (IR, 3–1100 μm) luminosity vs. redshift for the results from XID+ with the flat prior (red points/bars) and the informed Gaussian prior (blue points/bars) with a histogram of the IR luminosities. The green line corresponds to the 250 μm 5σ confusion limit.
Current usage metrics show cumulative count of Article Views (full-text article views including HTML views, PDF and ePub downloads, according to the available data) and Abstracts Views on Vision4Press platform.
Data correspond to usage on the plateform after 2015. The current usage metrics is available 48-96 hours after online publication and is updated daily on week days.
Initial download of the metrics may take a while.