Fig. 1
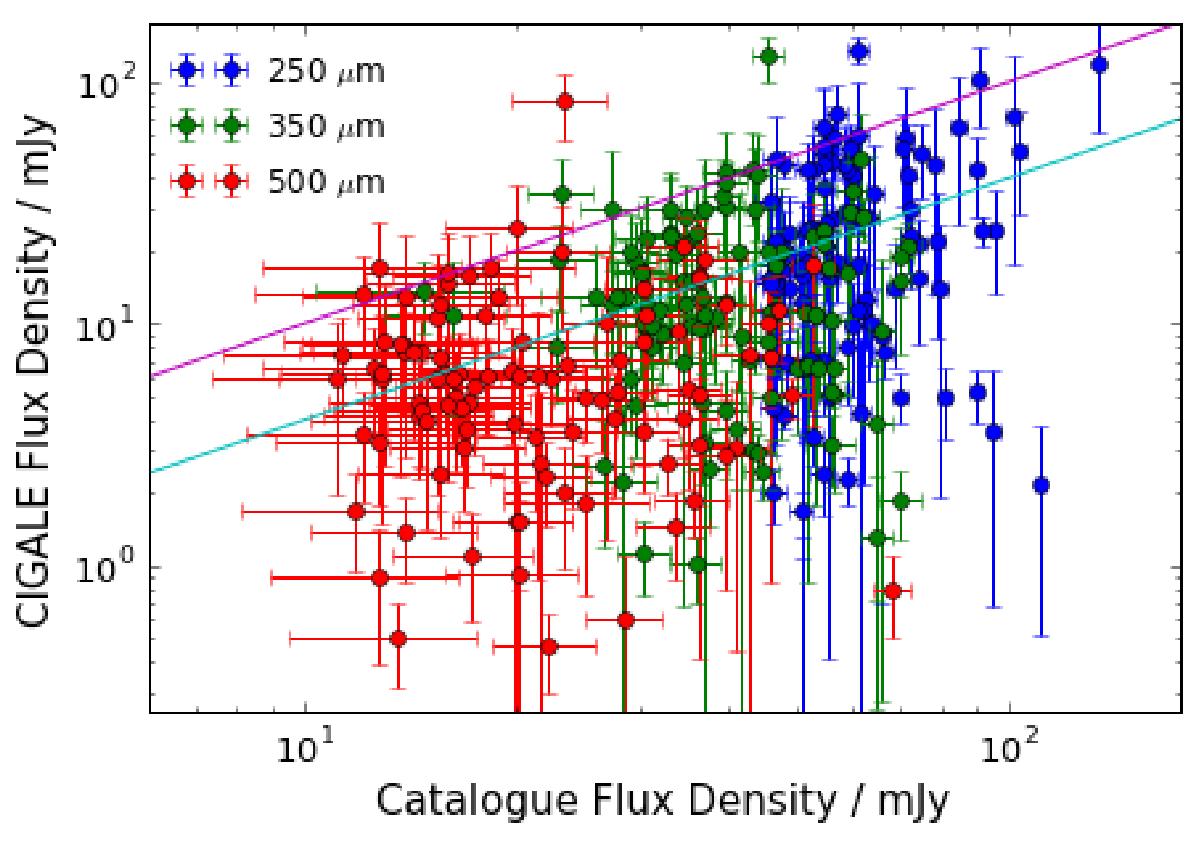
Scatter plot of the predicted CIGALE flux densities against the flux densities from the COSMOS2015 catalogue for the 250 μm (blue points), 350 μm (green points), and 500 μm (red points). The errors for the catalogue flux are instrumental noise plus confusion noise. The one-to-one line (magenta) and y = 0.4x (cyan) illustrate that the data better fits the idea that bright sources in catalogues are overestimated.
Current usage metrics show cumulative count of Article Views (full-text article views including HTML views, PDF and ePub downloads, according to the available data) and Abstracts Views on Vision4Press platform.
Data correspond to usage on the plateform after 2015. The current usage metrics is available 48-96 hours after online publication and is updated daily on week days.
Initial download of the metrics may take a while.