Fig. 4
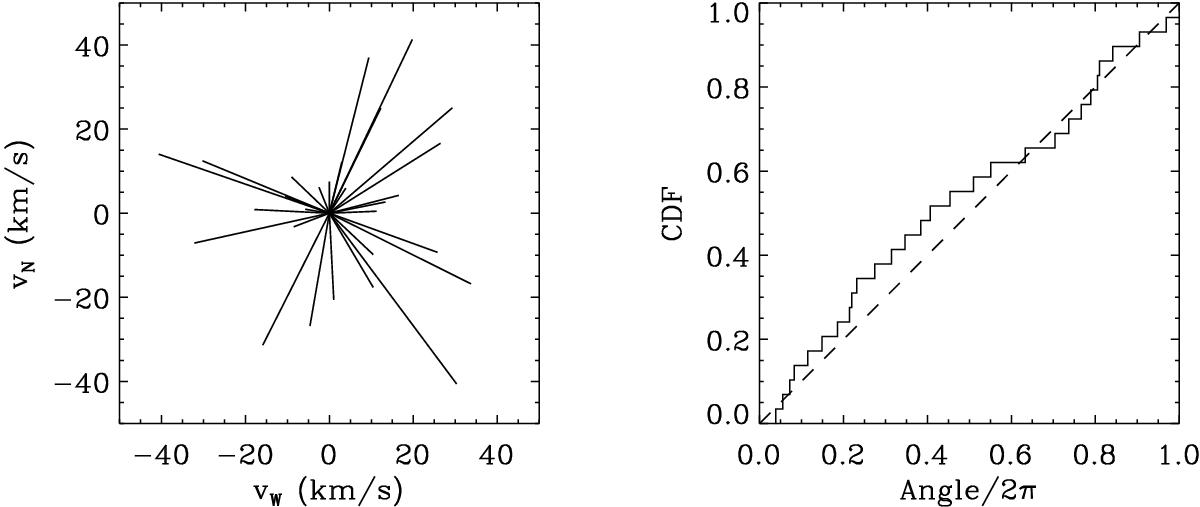
Left panel: plot of vW and vN (from Table 1); right panel: cumulative distribution function (CDF) of the position angles of these vectors as a histogram. The straight dashed line represents the CDF of a random distribution. A formal comparison of the two distributions using the Kuiper test indicates that the observations are consistent with this random distribution at a significance level of 85%.
Current usage metrics show cumulative count of Article Views (full-text article views including HTML views, PDF and ePub downloads, according to the available data) and Abstracts Views on Vision4Press platform.
Data correspond to usage on the plateform after 2015. The current usage metrics is available 48-96 hours after online publication and is updated daily on week days.
Initial download of the metrics may take a while.