Fig. 5
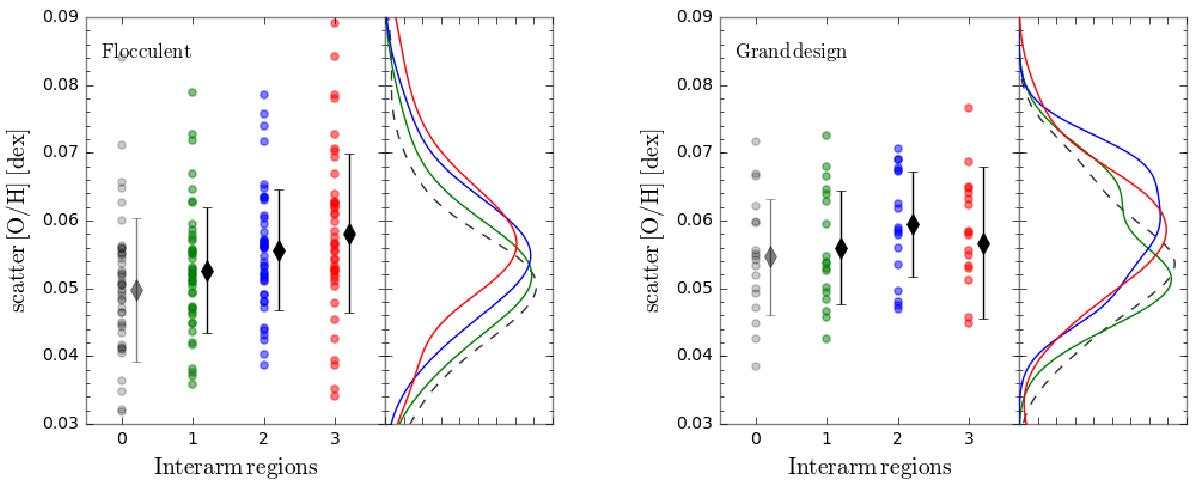
Distribution of the scatter of the oxygen abundances in the interarm regions according to the angular distance to the spiral arms for flocculent (left panel) and grand design (right panel) galaxies. Region 0 (grey) represents the arm region. Region 1 (green) is the interarm region closest to the spiral arms and region 3 (red) is the farthest away. Region 2 (blue) represents an intermediate region between 1 and 3. Each point represents the scatter of the SF spaxels within the corresponding interarm region for a particular galaxy. The black diamonds represent the mean values within each region; the error bars indicate the standard deviations. We also show the distribution of values for each region in the right auxiliary panels.
Current usage metrics show cumulative count of Article Views (full-text article views including HTML views, PDF and ePub downloads, according to the available data) and Abstracts Views on Vision4Press platform.
Data correspond to usage on the plateform after 2015. The current usage metrics is available 48-96 hours after online publication and is updated daily on week days.
Initial download of the metrics may take a while.